100 |
Investor Guide to Europe 2014
Turkey attracts investors from across the globe,
with overseas investors concentrating their activity
towards Istanbul. Turkey has a large and dynamic
market, with a relatively high quality labour force
and economic location advantages, with easy access
to regional markets.
The real estate market is comparatively small, but growing
and has doubled in size since 2006. As a result investment
activity remains relatively low; this is reflected in lower levels
of liquidity.
legislation to create REITs came into effect in 1995. There are
currently 29 REITs trading on the Istanbul Stock Exchange.
Their market share has been relatively low in recent years.
The retail sector has been the biggest capital recipient due
to the relatively high growth potential of this sector and
availability of investment grade property. The office sector
is also being successfully targeted by investors, with more
modern stock being developed and let to a growing number
of tenants. There is lack of quality in the industrial property
sector and demand is mostly driven by local companies.
Commercial and saving banks grant loans of varying
maturities, underwrite, issue, and trade in securities for
customers. They account for the largest portion of the
business volume and are active in most types of banking
operations. Besides, development and investment banks
serve to finance the big investments and infrastructure
constructions.
In order to catch its potential Turkey has to build confidence in
its economy by ensuring transparency, political and regulatory
stability.
Market sizing
Turkey
Europe
Invested stock*
(Total stock)
EUR 25bn
(EUR 420bn)
EUR 3,380bn
(EUR 8,150bn)
liquidity ratio*
(10y average)
0.3%
(2.5%)
4.0%
(4.5%)
2013 volumes
(10y average)
EUR 0.1bn
(EUR 0.4bn)
EUR 139bn
(EUR 135bn)
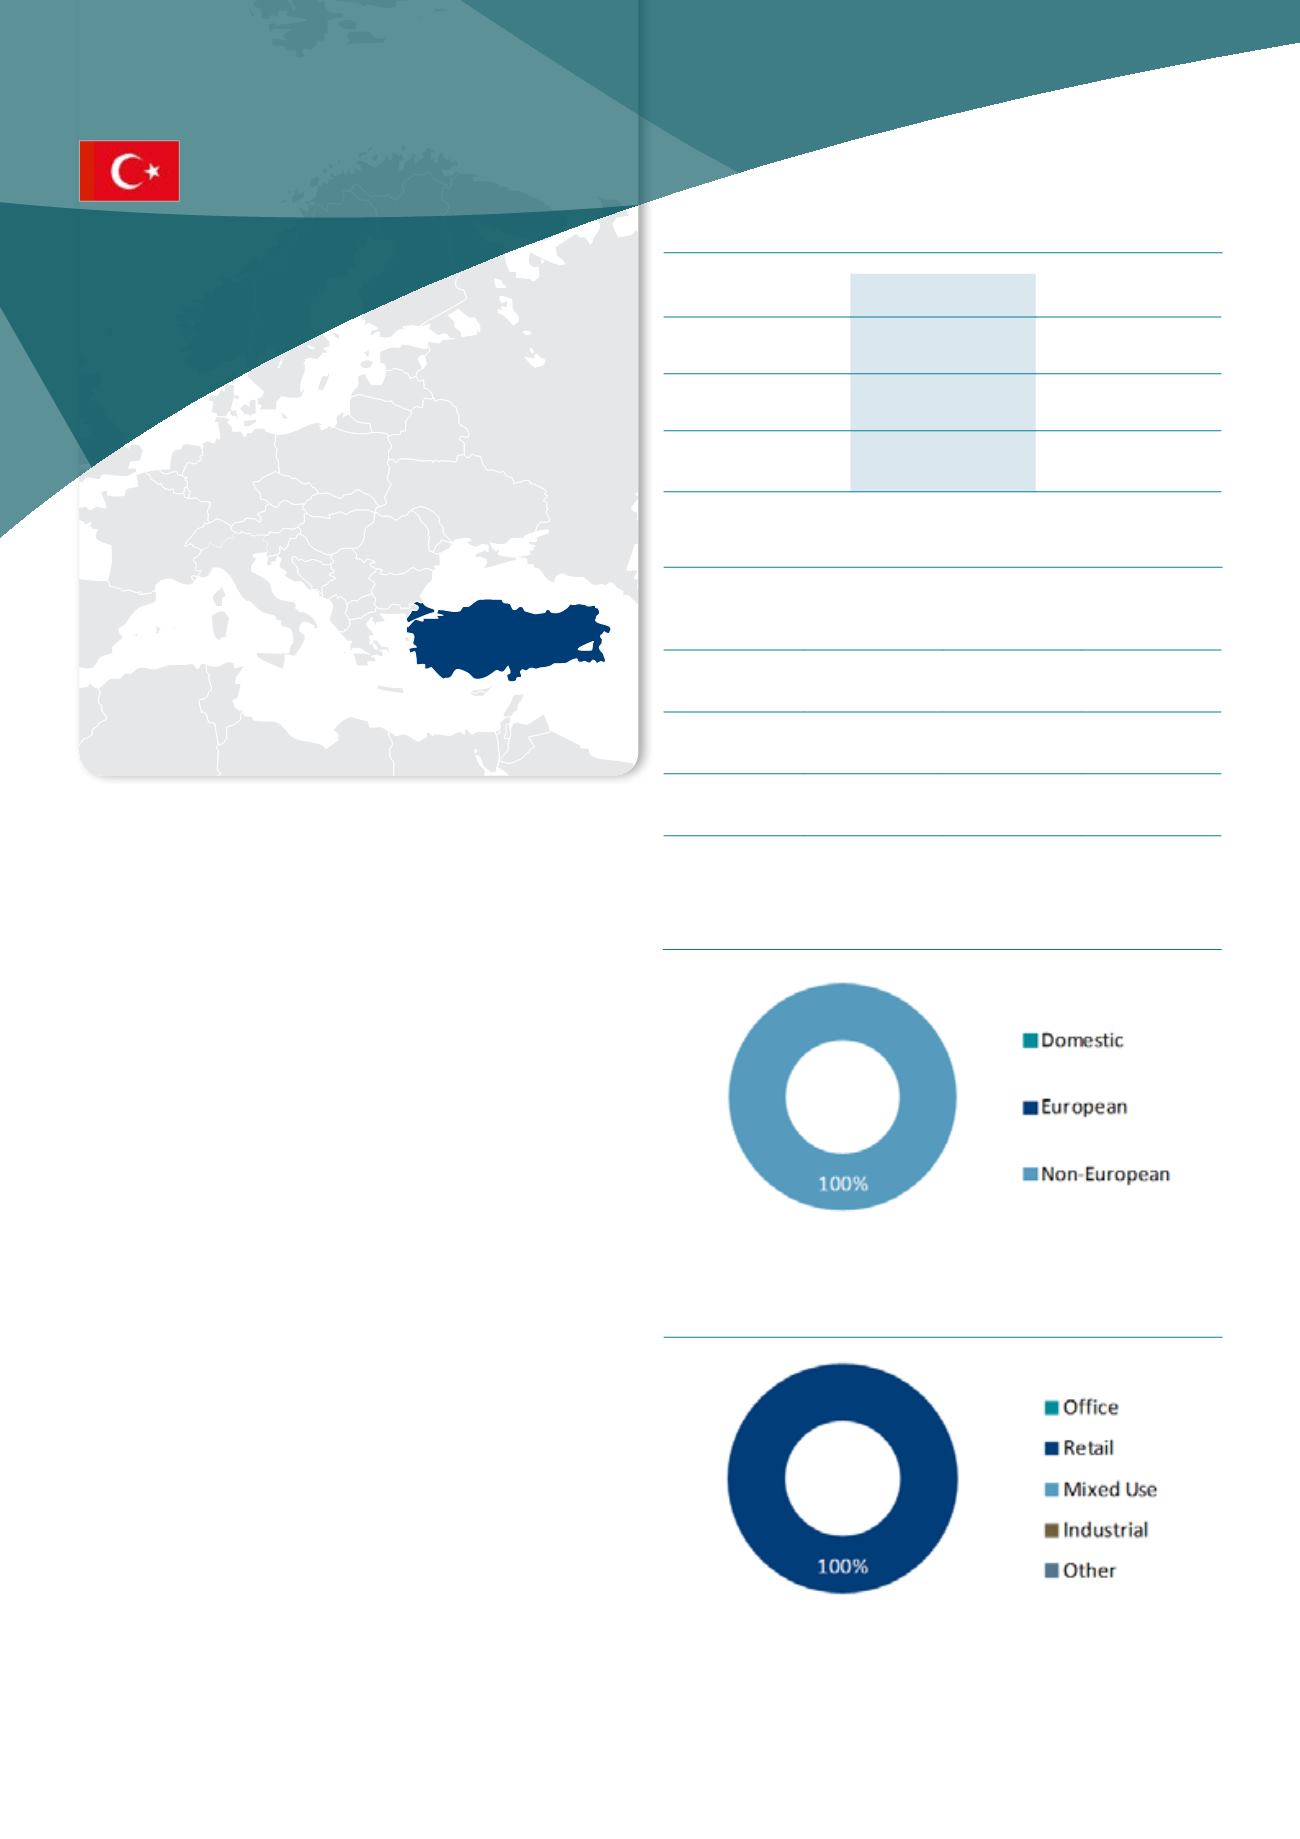
Investment activity by asset type, 2013
Source : DTZ Research
Investment activity by source of capital, 2013
Source : DTZ Research
Market pricing – Istanbul (Q4 2013)
office
Retail
Industrial
Current Yield 7.00% 6.25% 8.50%
Min/Max
(10y)
7.00-10.00% 6.25-12.00% 8.50-12.00%
Yield
definition
net initial yield
Source : DTZ Research
TuRKEY
* 2012 figures


