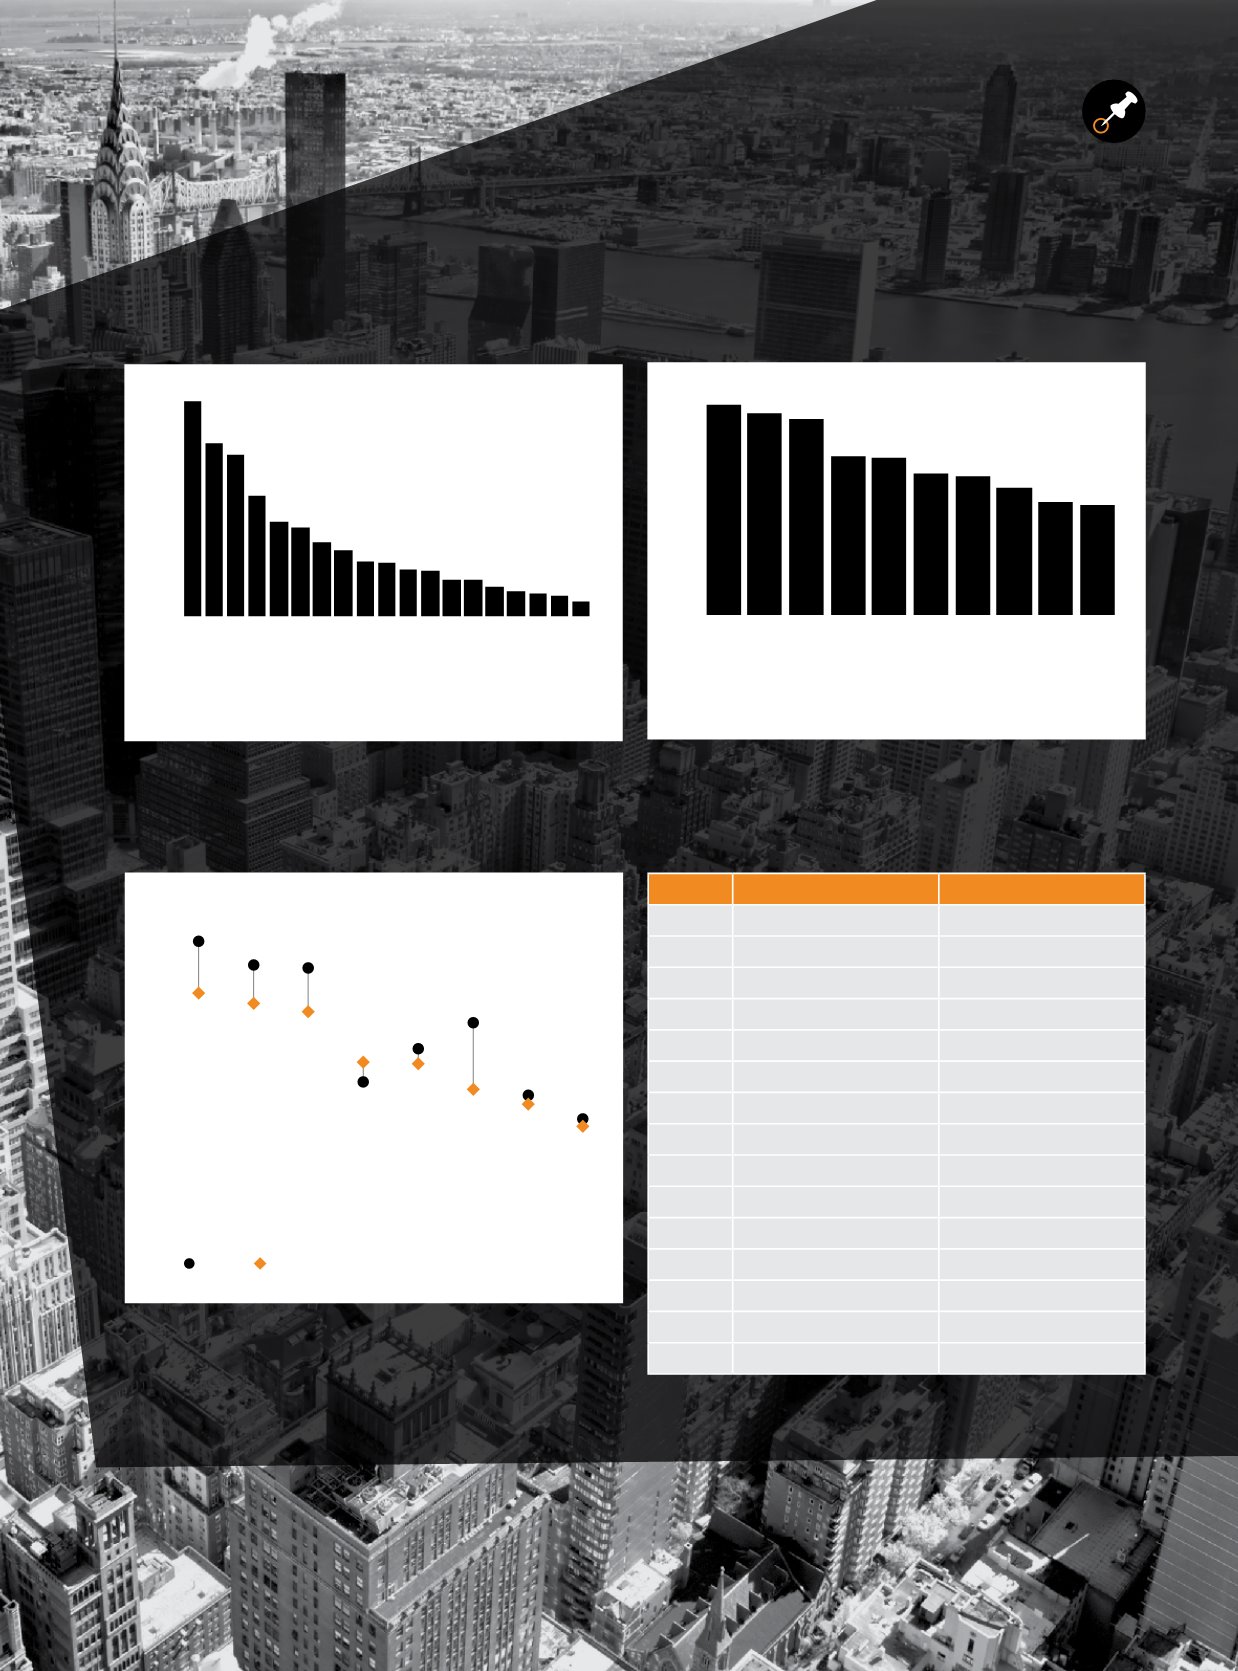
Table 2: Occupancy costs per workstation
(to year-end 2013)
Rank Country
Cost USD
1
London (West End)
26,310
2
Hong Kong
21,600
3
Lagos
17,590
4
Zurich
17,060
5
Geneva
16,990
6
Moscow
15,650
7
Stockholm
15,140
8
London (City)
15,070
9
Oslo
14,260
10
Paris
13,960
12
Frankfurt
13,500
13
Tokyo
13,430
16
Sydney
12,400
21
New York
11,360
24
Singapore
11,130
Source: DTZ Research
Source: DTZ Research
Source: DTZ Research
Figure 4: Office stock in key Global cities
(million sq m)
Figure 5: Space utilisation per workstation
(sq m)
Figure 6: Space utilisation per workstation sq m
(2003 vs 2013)
0
5
10
15
20
25
30
New York
Tokyo
London
Paris
Moscow
Frankfurt
Zurich
Chicago
Boston
Hong Kong
Shanghai
Singapore
San Francisco
Sydney
Warsaw
Luxembourg
Budapest
Houston
Taipei
0
5
10
15
20
Frankfurt
New York
Chicago
Hong Kong
Sydney
Shanghai
Paris
Singapore
Edinburgh
London (City)
10
15
20
25
Frankfurt
New York
Chicago
Hong Kong
Sydney
Paris
Singapore
London
2003 2013
Source: DTZ Research
29
The future of the financial workplace
|
September 2014


