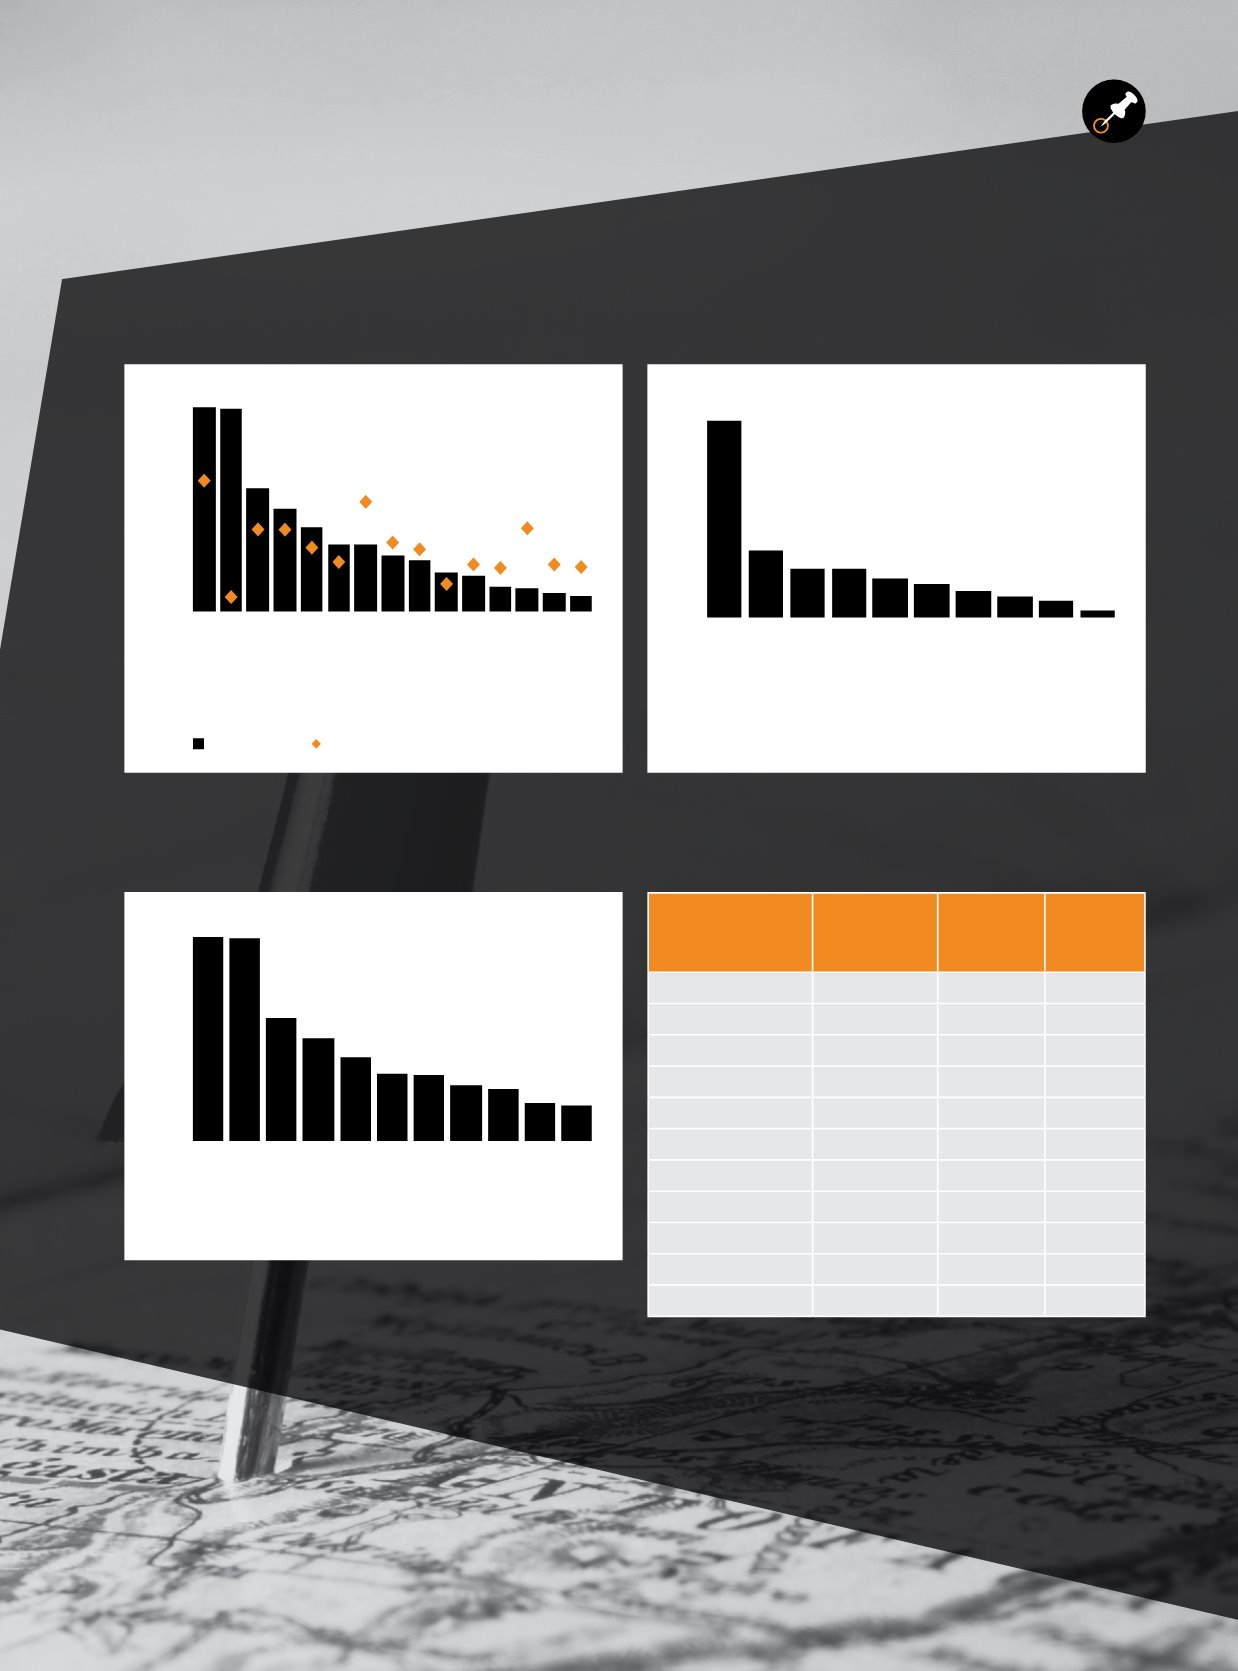
Source: Oxford Economics, DTZ Research
Source: World Federation of Exchanges,
DTZ Research, Bloomberg
Source: The World Federation of Exchanges,
DTZ Research, Bloomberg
Figure 1: Financial services employment (000s)
and output per worker (000 USD), 2013
Figure 3: No. of listed foreign companies (Dec 2013)
Figure 2: Equity markets capitalisation
(USD tn, Dec 2013)
0
100
200
300
400
500
600
New York
Shanghai
London
Tokyo
Hong Kong
Singapore
Chicago
Sydney
Paris
Taipei
Zurich
Kuala Lumpur
Amsterdam
Frankfurt
Berlin
Employment Output
New York
Shanghai
London
Tokyo
Hong Kong
Singapore
Chicago
Sydney
Paris
Taipei
Zurich
0
100
200
300
400
500
600
0
5
10
15
20
NYSE (US)
NASDAQ
Tokyo
London
NYSE (EU)
Hong Kong
Shanghai
Frankfurt
Zurich
Singapore
Country
Corruption
(n=185)
Business
Freedom
(n=185)
Political
Stability
(n=187)
Hong Kong
13
1
12
Singapore
5
3
3
United Kingdom 17
9
17
Germany
14
13
18
Netherlands
8
15
9
United States
23
17
22
Japan
16
32
24
France
26
33
23
South Africa
64
52
74
Brazil
72
144
108
China
77
153
87
Table 1: Country risk rankings
Source: DTZ Research, Oxford Economics, Heritage Foundation
27
The future of the financial workplace
|
September 2014


