


 66 / 132

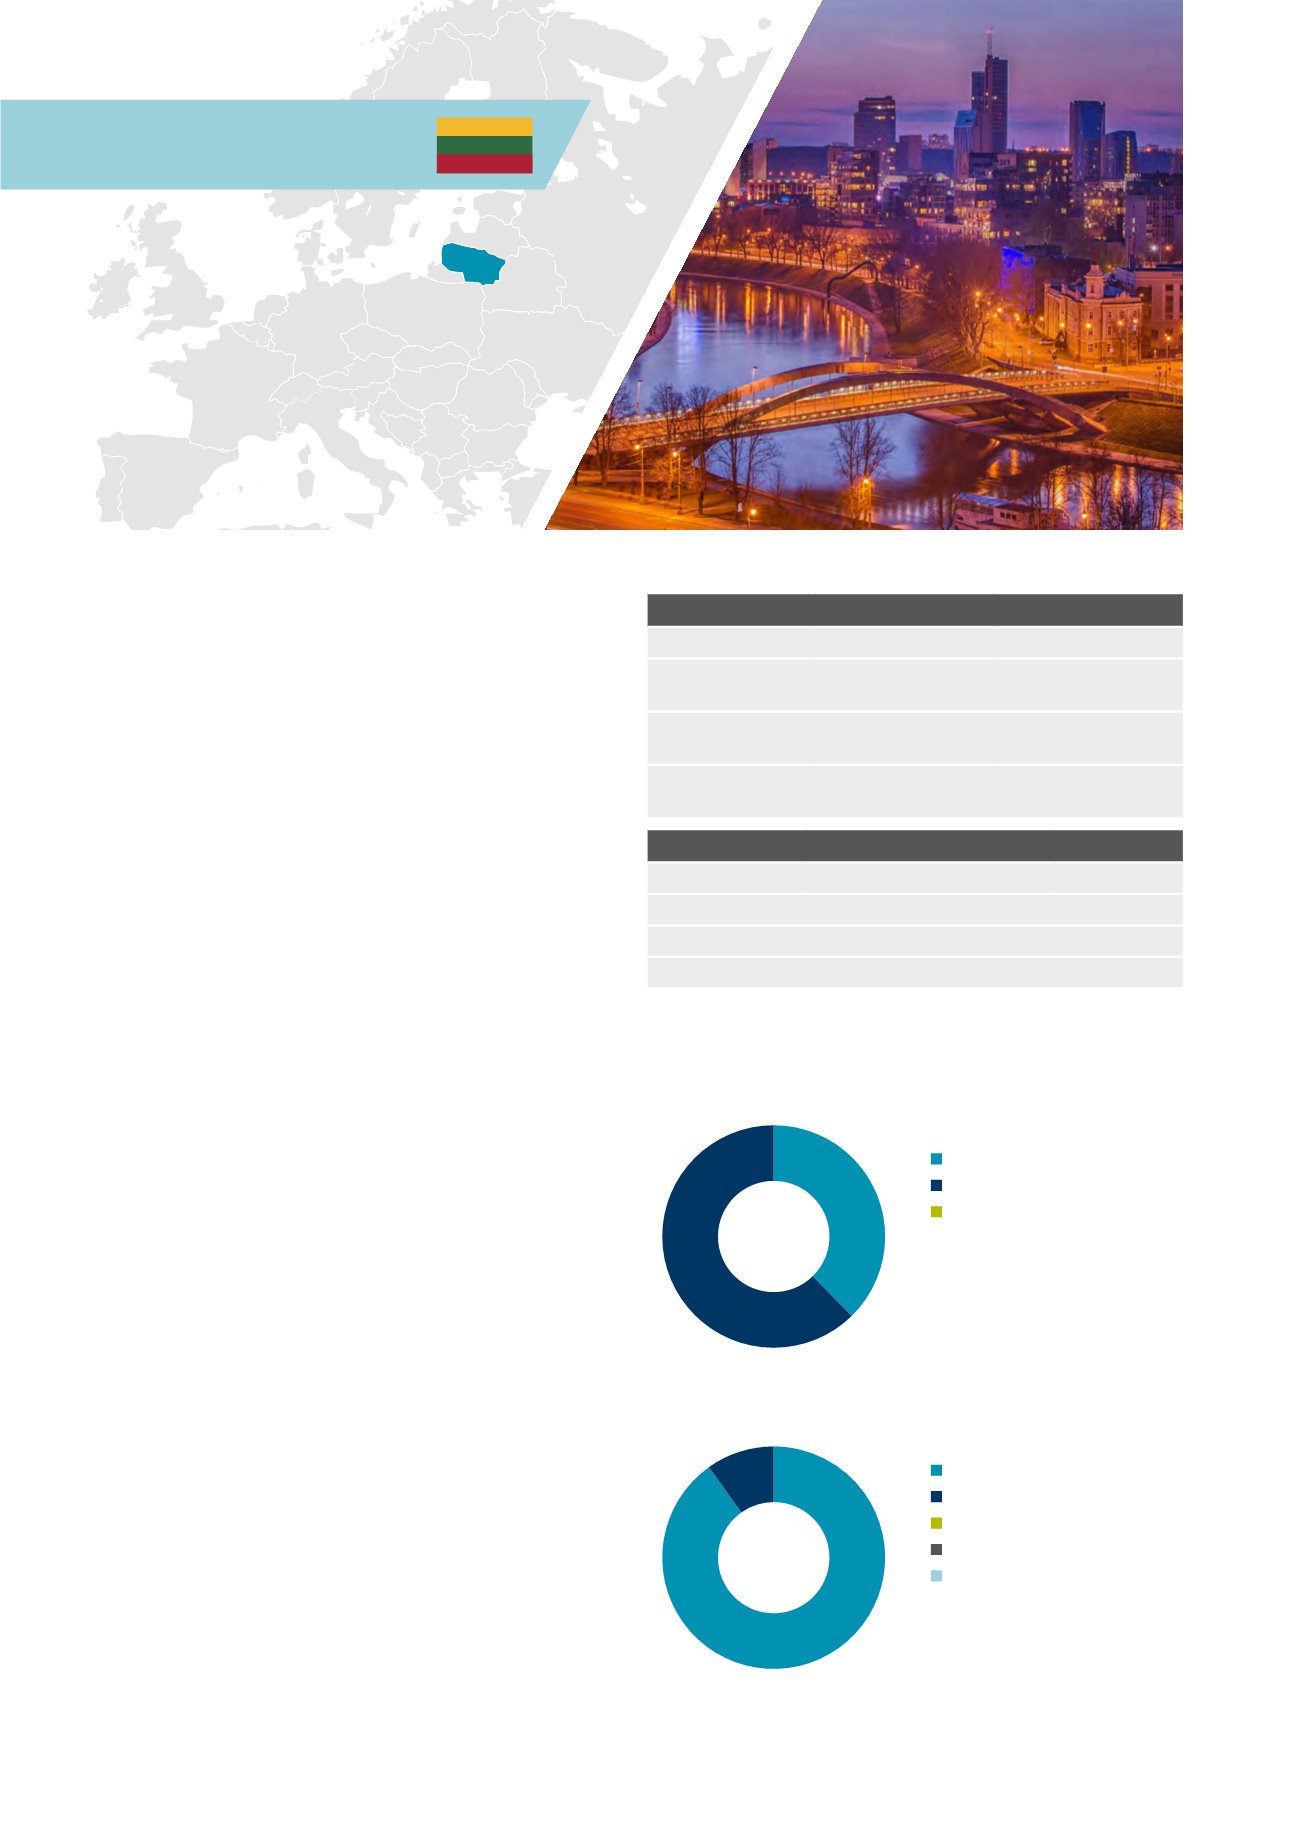
Lithuania
Lithuania, along with its Baltic neighbours,
Latvia and Estonia is one of the smallest
markets across Europe. Lithuania’s invested
stock is a modest EUR6bn, although with an
estimated total stock of close to EUR40bn, the
country represents an opportunity.
The Lithuanian market grew rapidly from 2000, and
was spurred on by some cross border investment
in 2003, when Baltic Property Trust from Denmark
made its first acquisition in the country. Accession to
the European Union also spurred more cross border
investment from a market previously controlled by
local investors and developers.
In the wake of the financial crisis the market has
struggled, although aggregate gearing has been
relatively modest and this has been reflected in low
levels of foreclosures.
Within the last two years, market activity has
gradually improved. The oversupply of commercial
premises has been successfully absorbed. In 2012,
new developments in the office segment commenced
and in 2013, retail projects that were put on hold five
years ago have been re-introduced into the active
pipeline.
Developments across all commercial real estate
segments are not confined to capital city Vilnius.
Substantial interest is also generated by the
second largest city Kaunas, a crossroad to multiple
international auto arteries, and international seaport
Klaipeda. Secondary cities Panevezys and Siauliai are
also on the list for investors.
Market sizing
Lithuania
Europe
Invested stock
(Total stock)
EUR 6bn
(EUR 39bn)
EUR 3,335bn
(EUR 8,201bn)
Liquidity ratio
(10y average)
2.2%
(0.8%)
5.6%
(4.6%)
2014 volumes
(10y average)
EUR 0.1bn
(EUR 0.1bn)
EUR 187bn
(EUR 142bn)
Market pricing – Vilnius (Q4 2014)
Office
Retail
Industrial
Current Yield
7.50%
7.50%
9.50%
Min/Max (10y)
6.25-9.00% 6.00-8.50% 7.00-11.00%
Yield definition
Net initial yield
Source: DTZ Research
Investment activity by source of capital, 2014
Investment activity by asset type, 2014
Source: DTZ Research
Source: DTZ Research
Domestic
Non-European
European
Office
Mixed Use
Retail
Industrial
Other
38%
62%
90%
10%
66 Investors Guide to Europe 2015