


 62 / 132

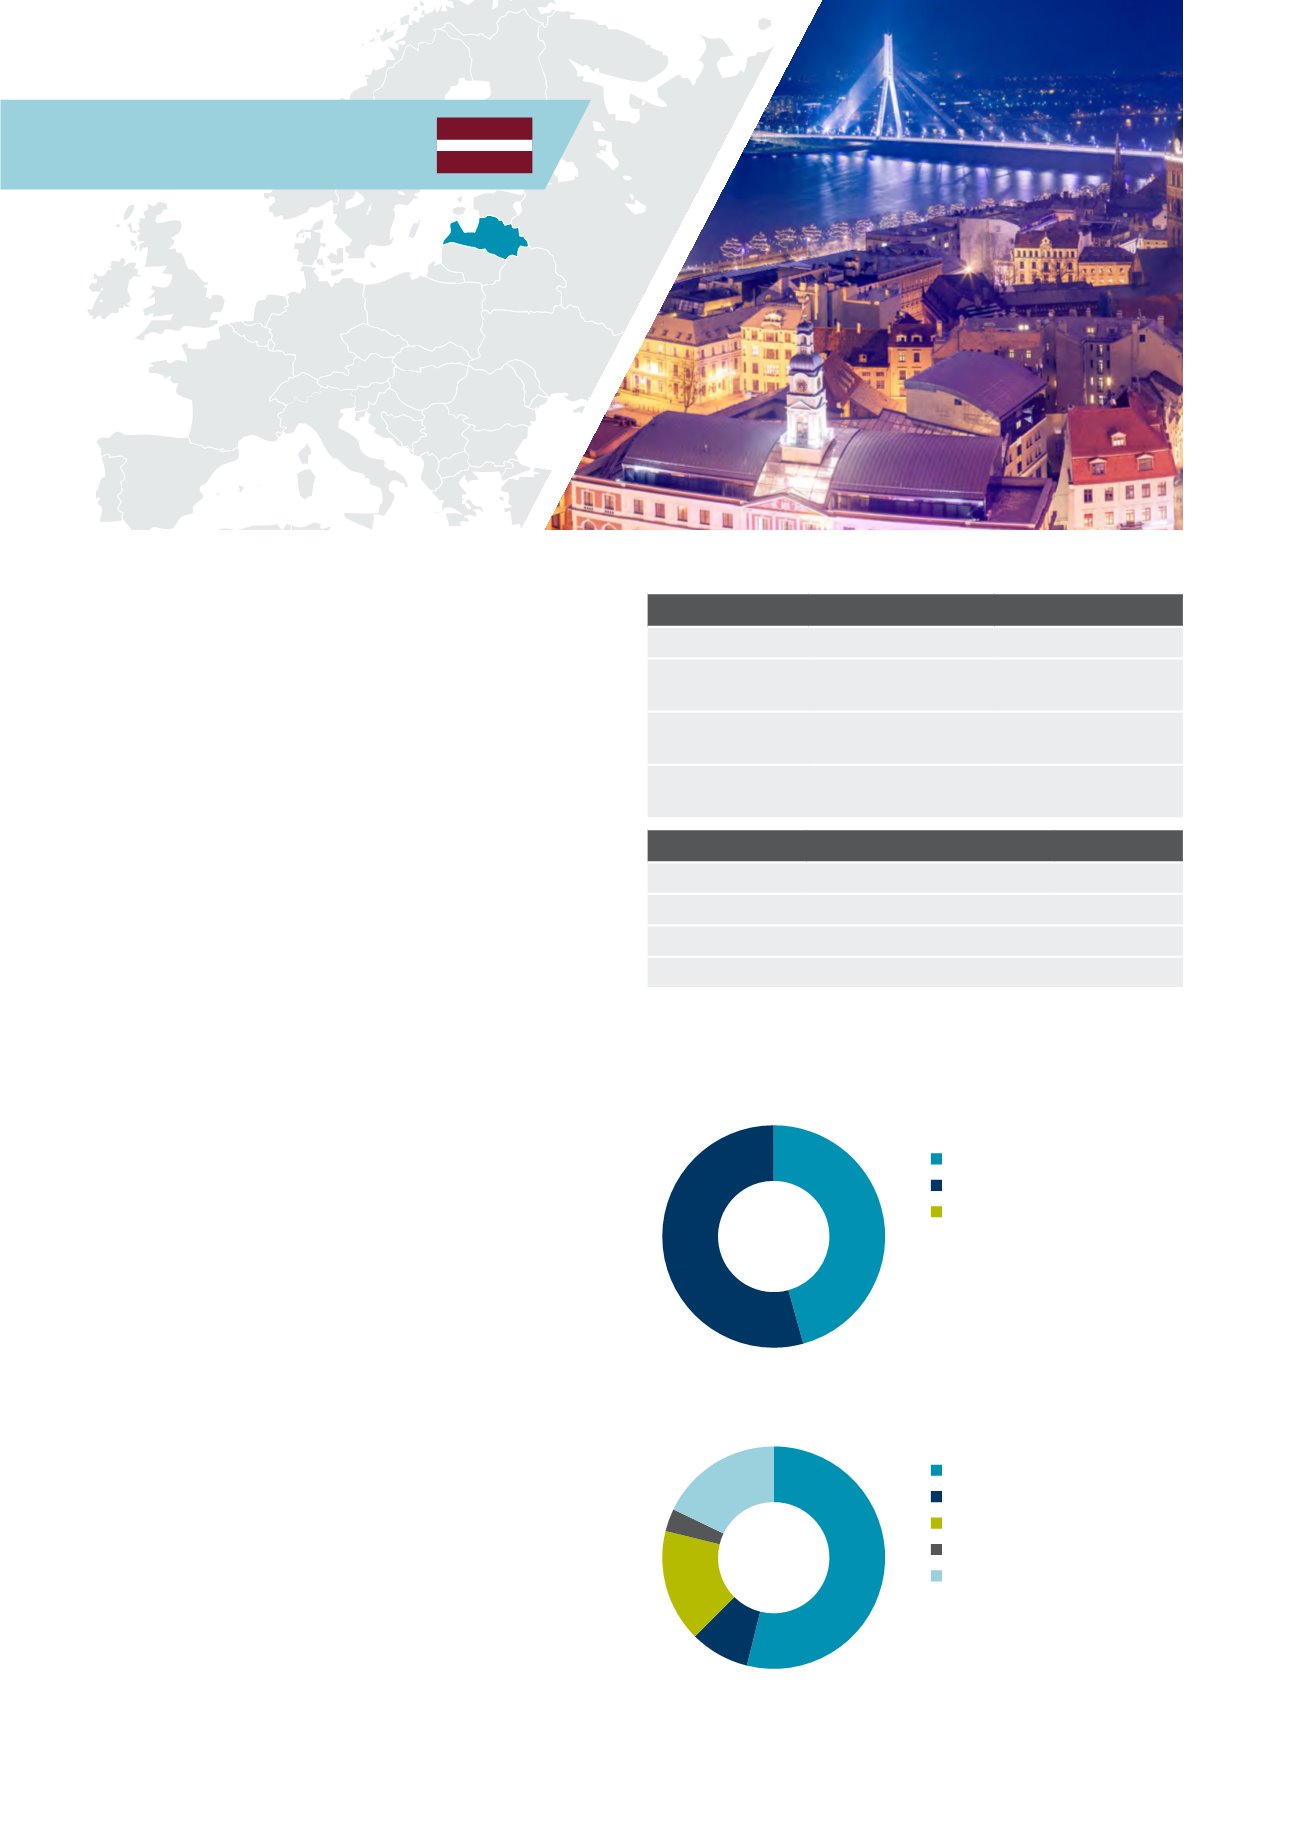
Latvia
The real estate market in Latvia is steadily
recovering from a complete standstill. Many
investors wish to benefit from low construction
prices and developers are maximizing the
potential of their assets. Tenants are optimizing
their leases, and in some sectors demand
exceeds supply. This unique situation can
greatly benefit the knowledgeable and the
quick-witted.
The Latvian market is still in its infancy and this is
reflected in the size of its stock. Despite being one
of Europe’s smallest markets it has been evolving
rapidly over the past decade. We expect this trend to
continue and will offer opportunities for investors.
Latvia with its policy of conferring residency status
through investment in real estate attracts a lot
of interest from private individuals from Russia
and CIS (Commonwealth of Independent States)
countries. Many concentrate their activity towards
the capital city of Riga. Latvia is also on the active
list for institutional investors coming from within
the Baltic region itself (Estonia in particular) and
from Scandinavian countries. Asset transfer deals
and share transfer deals are both common practice,
whereas institutional investment within the country is
limited to close-ended real estate funds managed by
asset management companies.
Debt funding for existing commercial assets is
relatively easy to obtain, whereas development
opportunities have to be backed-up with a clear asset
development strategy. With the recent accession to
Eurozone, capital availability improved; the capacity
of developers is still under-exploited, whereas
government policy is generally favourable.
Market sizing
Latvia
Europe
Invested stock
(Total stock)
EUR 6bn
(EUR 14bn)
EUR 3,335bn
(EUR 8,201bn)
Liquidity ratio
(10y average)
2.5%
(0.4%)
5.6%
(4.6%)
2014 volumes
(10y average)
EUR 0.1bn
(EUR 0.1bn)
EUR 187bn
(EUR 142bn)
Market pricing – Riga (Q4 2014)
Office
Retail
Industrial
Current Yield
7.50% 6.50%
9.00%
Min/Max (10y)
6.50-9.50% 6.00-9.00% 9.00-11.00%
Yield definition
Net initial yield
Source: DTZ Research
Investment activity by source of capital, 2014
Investment activity by asset type, 2014
Source: DTZ Research
Source: DTZ Research
Domestic
Non-European
European
Office
Mixed Use
Retail
Industrial
Other
54%
46%
54%
9%
16%
3%
18%
62 Investors Guide to Europe 2015