


 70 / 132

Luxembourg
In terms of stock, Luxembourg is relatively
small, and this is reflected in the level of
activity, with volumes averaging less than
EUR1bn per annum over the last ten years. Its
location in the heart of Europe and its core
sectors of activity does attract investors from
across Europe, mainly from Belgium, France and
Germany. As a result the country has benefitted
from above average levels of liquidity.
Private investors, unlisted funds, notably German
funds, and institutions are the most active players in
the Luxembourg market. Very little is traded or owned
by listed companies. Furthermore, investors from
the Middle-East and Asia are increasingly visible.
Four of the most important Chinese banks have now
established operations in Luxembourg.
Offices represent the most sought-after asset
class, accounting for more than 59% of the total
investment volume in 2014, below its the long run
average. Benefiting from dynamic letting activity
and with important projects in the pipeline, this
asset class should continue to attract investments,
both in small and large volumes. Some mixed-use
projects are currently under development and
could offer alternative investment strategies as the
competition for core office assets is increasing. Retail
and industrial/ logistics space does trade, though
volumes are typically lower.
Debt is readily available from traditional banks and
German Pfandbriefe banks. We do not see any real
institutional activity at present.
Market sizing
Luxembourg
Europe
Invested stock
(Total stock)
EUR 11bn
(EUR 24bn)
EUR 3,335bn
(EUR 8,201bn)
Liquidity ratio
(10y average)
6.8%
(7.3%)
5.6%
(4.6%)
2014 volumes
(10y average)
EUR 0.8bn
(EUR 0.9bn)
EUR 187bn
(EUR 142bn)
Market pricing – Luxembourg (Q4 2014)
Office
Retail
Industrial
Current Yield
5.25% 5.00%
8.50%
Min/Max (10y)
5.20-6.50% 5.00-6.00% 7.50-9.50%
Yield definition
Net initial yield
Source: DTZ Research
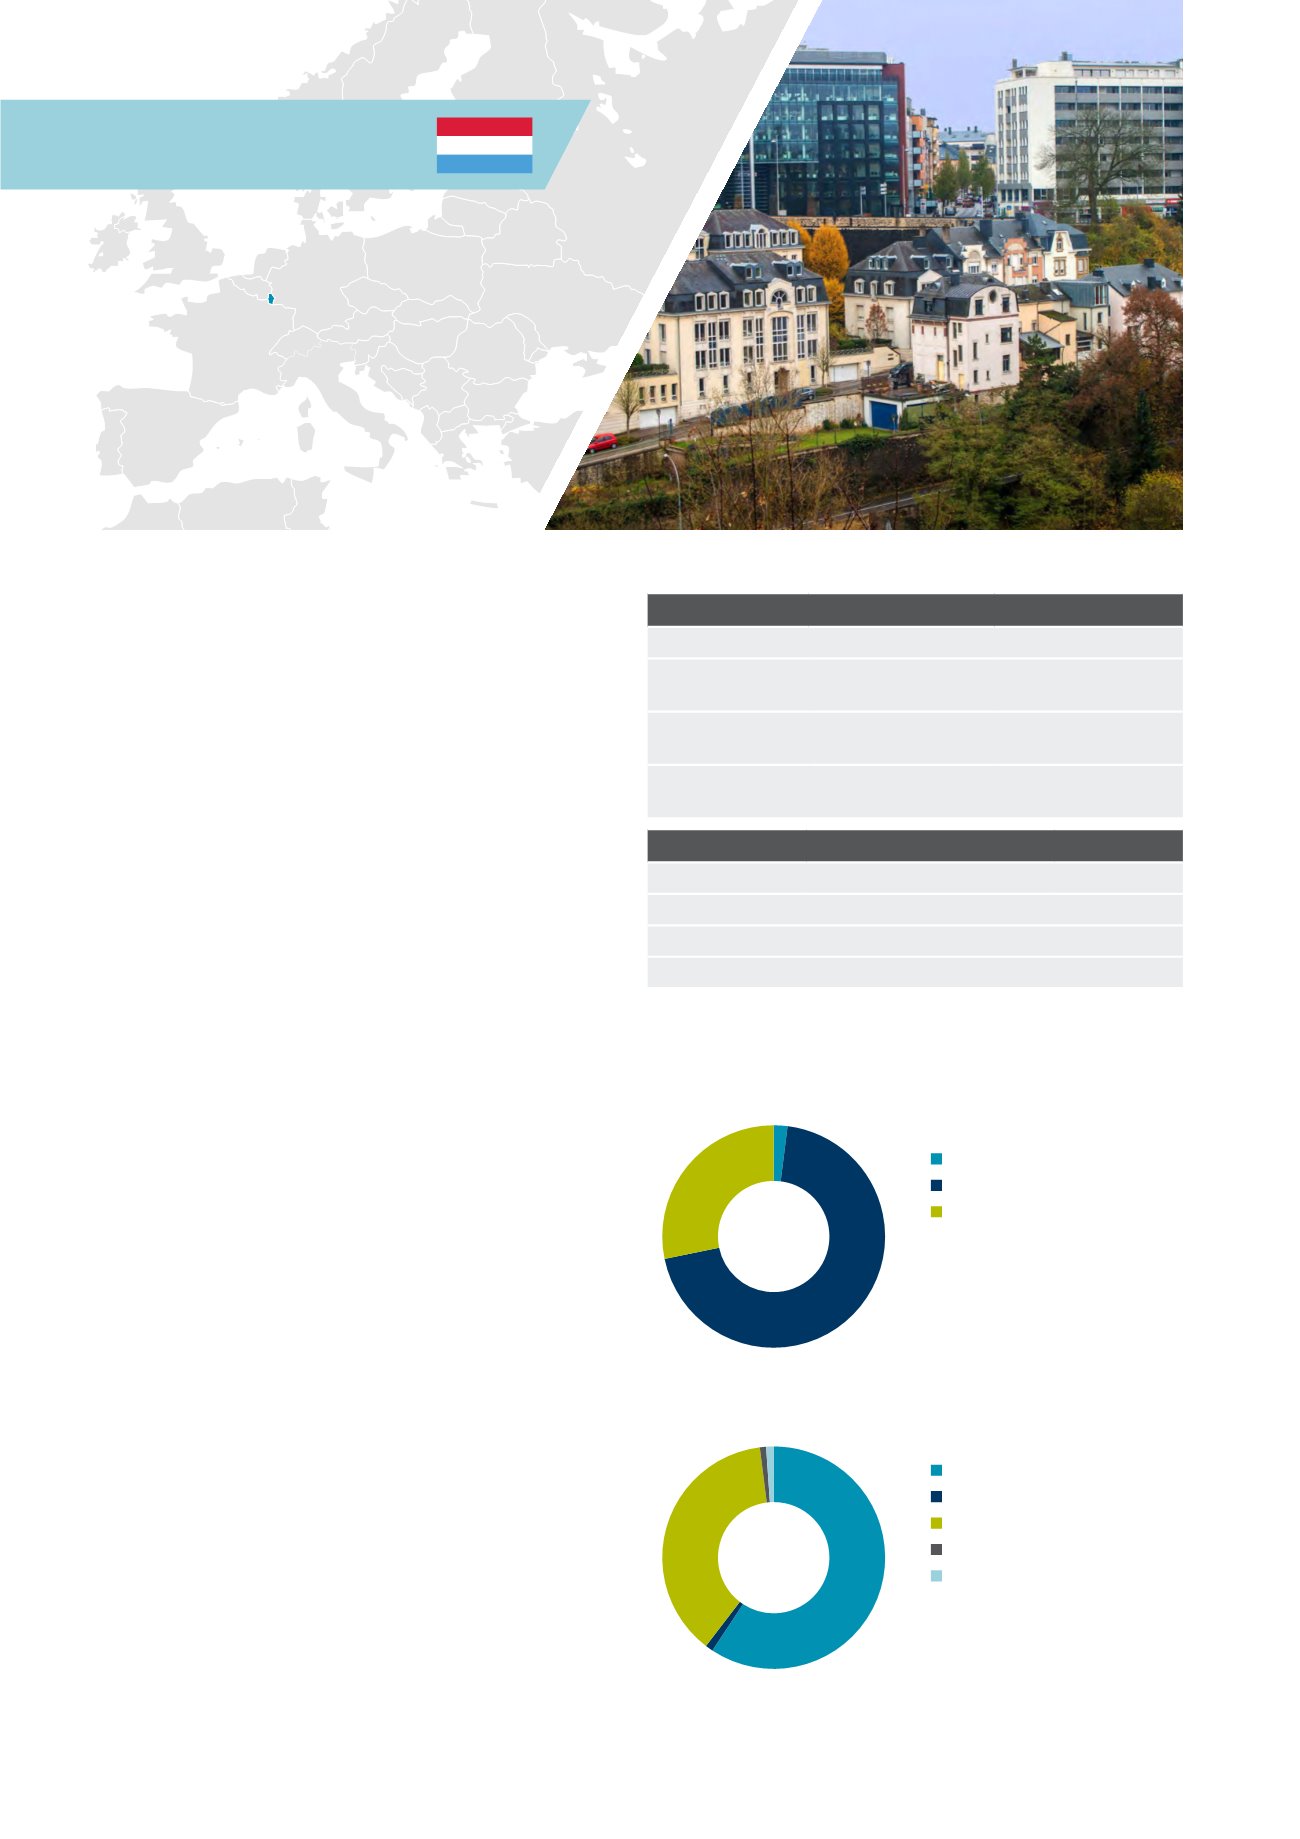
Investment activity by source of capital, 2014
Investment activity by asset type, 2014
Source: DTZ Research
Source: DTZ Research
Domestic
Non-European
European
Office
Mixed Use
Retail
Industrial
Other
38%
62%
70
28%
2%
59%
38%
1%
1% 1%
70 Investors Guide to Europe 2015