BANGKOK
2,910
BEIJING
10,290
BENGALURU
2,220
CHENNAI
1,900
CHENGDU
3,180
DALIAN
3,480
SHENYANG
5,440
HONG KONG
21,600
JAKARTA
4,280
MUMBAI
6,680
SEOUL
9,560
SHANGHAI
9,620
SINGAPORE
11,130
TAIPEI
8,060
TOKYO
13,430
KUALA LUMPUR
3,680
GUANGZHOU
5,850
HYDERABAD
1,250
KOLKATA
2,690
NANJING
2,820
HANGZHOU
4,440
QINGDA0
2,560
DELHI
8,160
PRAGUE
5,880
VILNIUS
3,710
WARSAW
5,990
BUCHAREST
3,930
MOSCOW
15,650
KYIV (KIEV)
6,350
ISTANBUL
9,900
MALMO
8120
STOCKHOLM
15,140
BUDAPEST
3,500
BERLIN
8,840
HELSINKI
12,460
TALLINN
3,860
RIGA
4,530
BRISBANE
9,770
PERTH
12,240
MELBOURNE
8,120
SYDNEY
12,400
CANBERRA
5,890
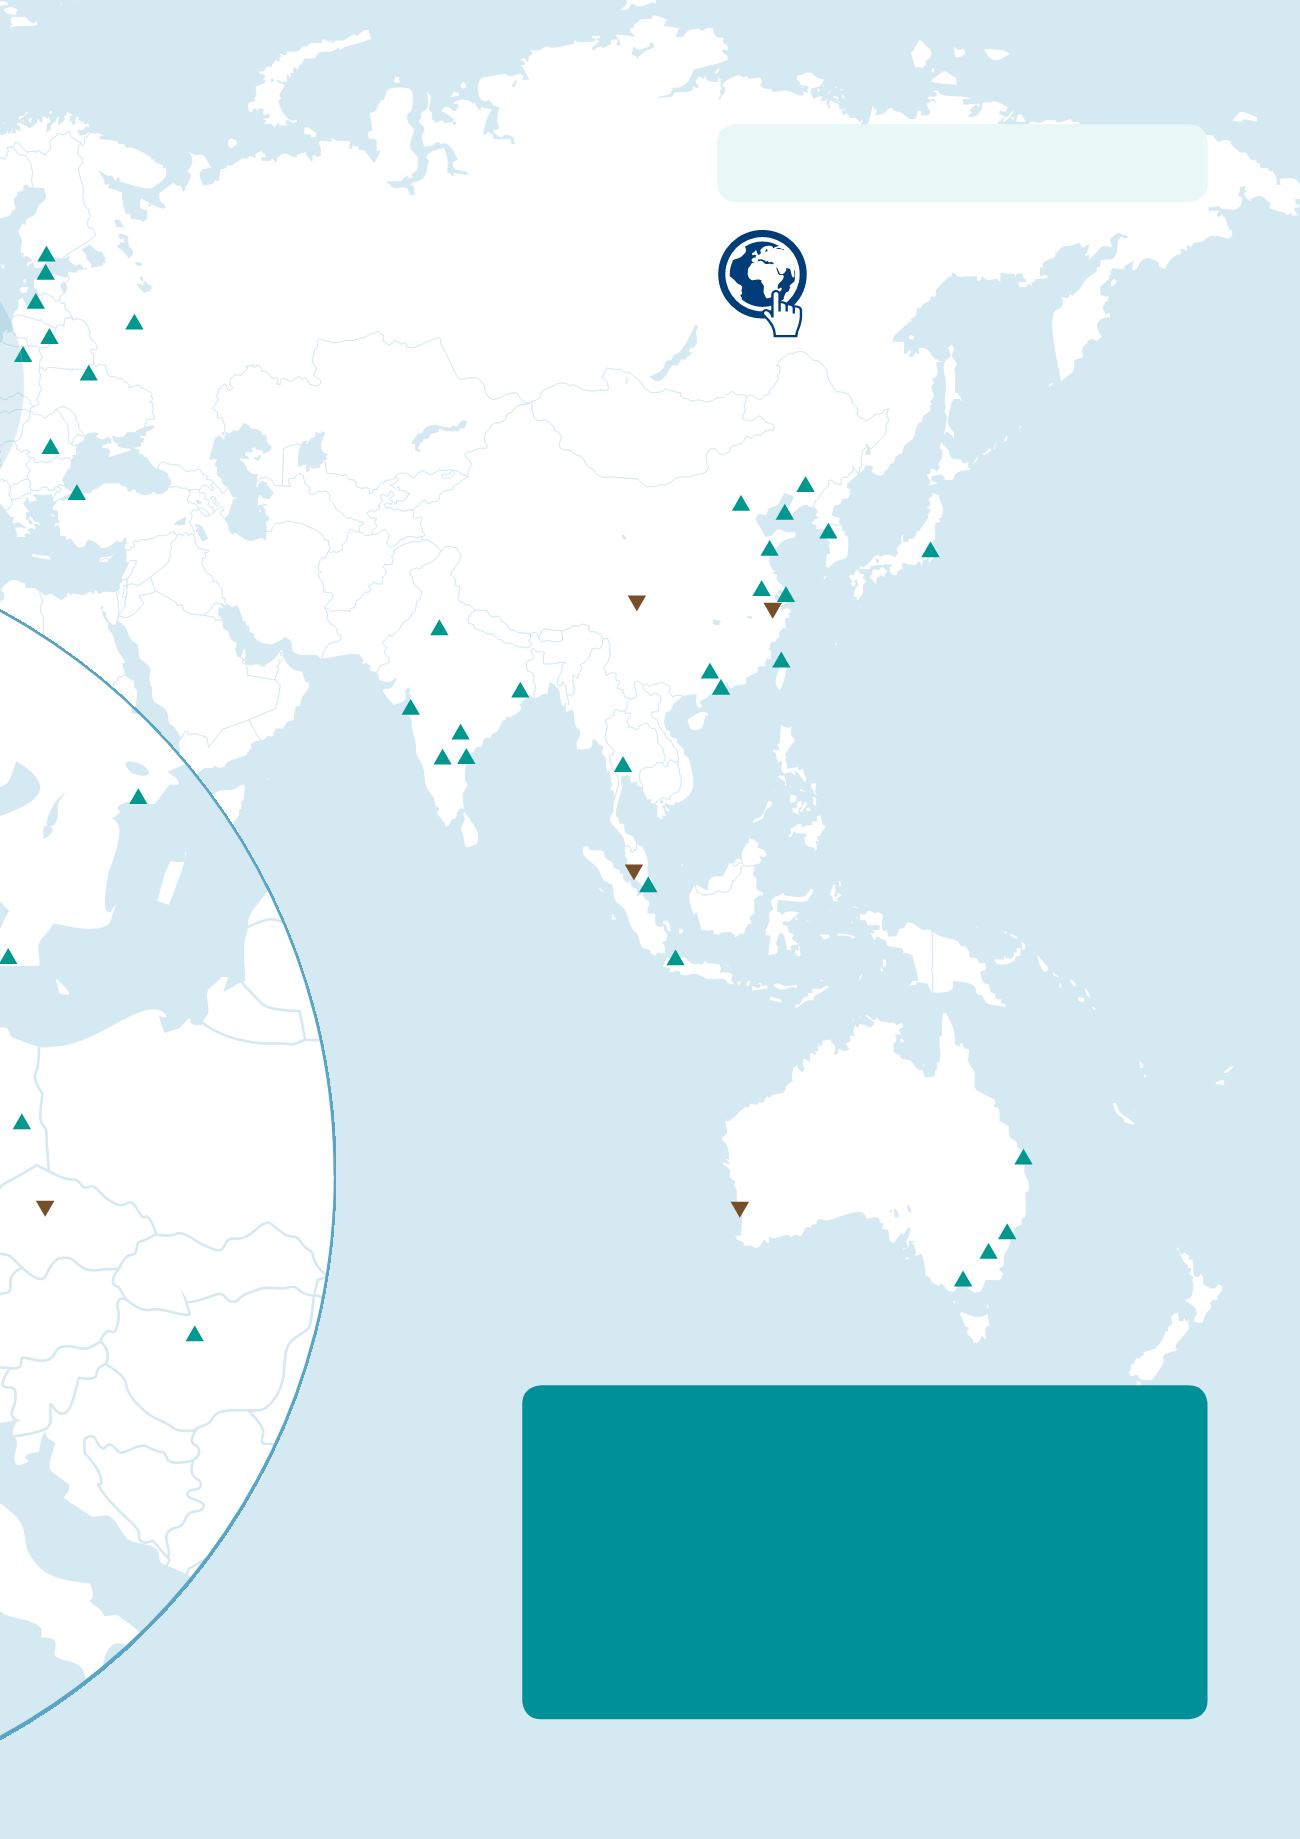
GLOBAL OCCUPIER METRICS
DTZ’s web based tool combines market data
and workplace strategy. See what you can
achieve at
HOW WE CALCULATE GLOBAL OCCUPANCY COSTS
Our globally integrated DTZ Research team tracks total occupancy costs
in numerous markets worldwide. Total occupancy costs are defined as the
average total cost of leasing prime net usable space. The costs include
rents and outgoings such as maintenance costs and property tax, if these
are normally payable by the occupier. Our methodology cuts through
local practices to provide a more accurate comparison of costs between
markets. We take into account the local markets’ definitions of ‘lease area’
and convert all local data into the RICS definition of Net Internal Area. We
also take into account the space allocated per workstation in each market
by collecting space utilisation standards. Thus, total occupancy costs are
presented on a per workstation and net internal area basis.
DTZ | In Situ 17


