10 |
Investor Guide to Europe 2014
Despite being relatively small, Belgium’s investment
market has benefited from above average levels of
liquidity. The position of Brussels as the Capital of
Europe attracts European investors from france,
Germany and the netherlands.
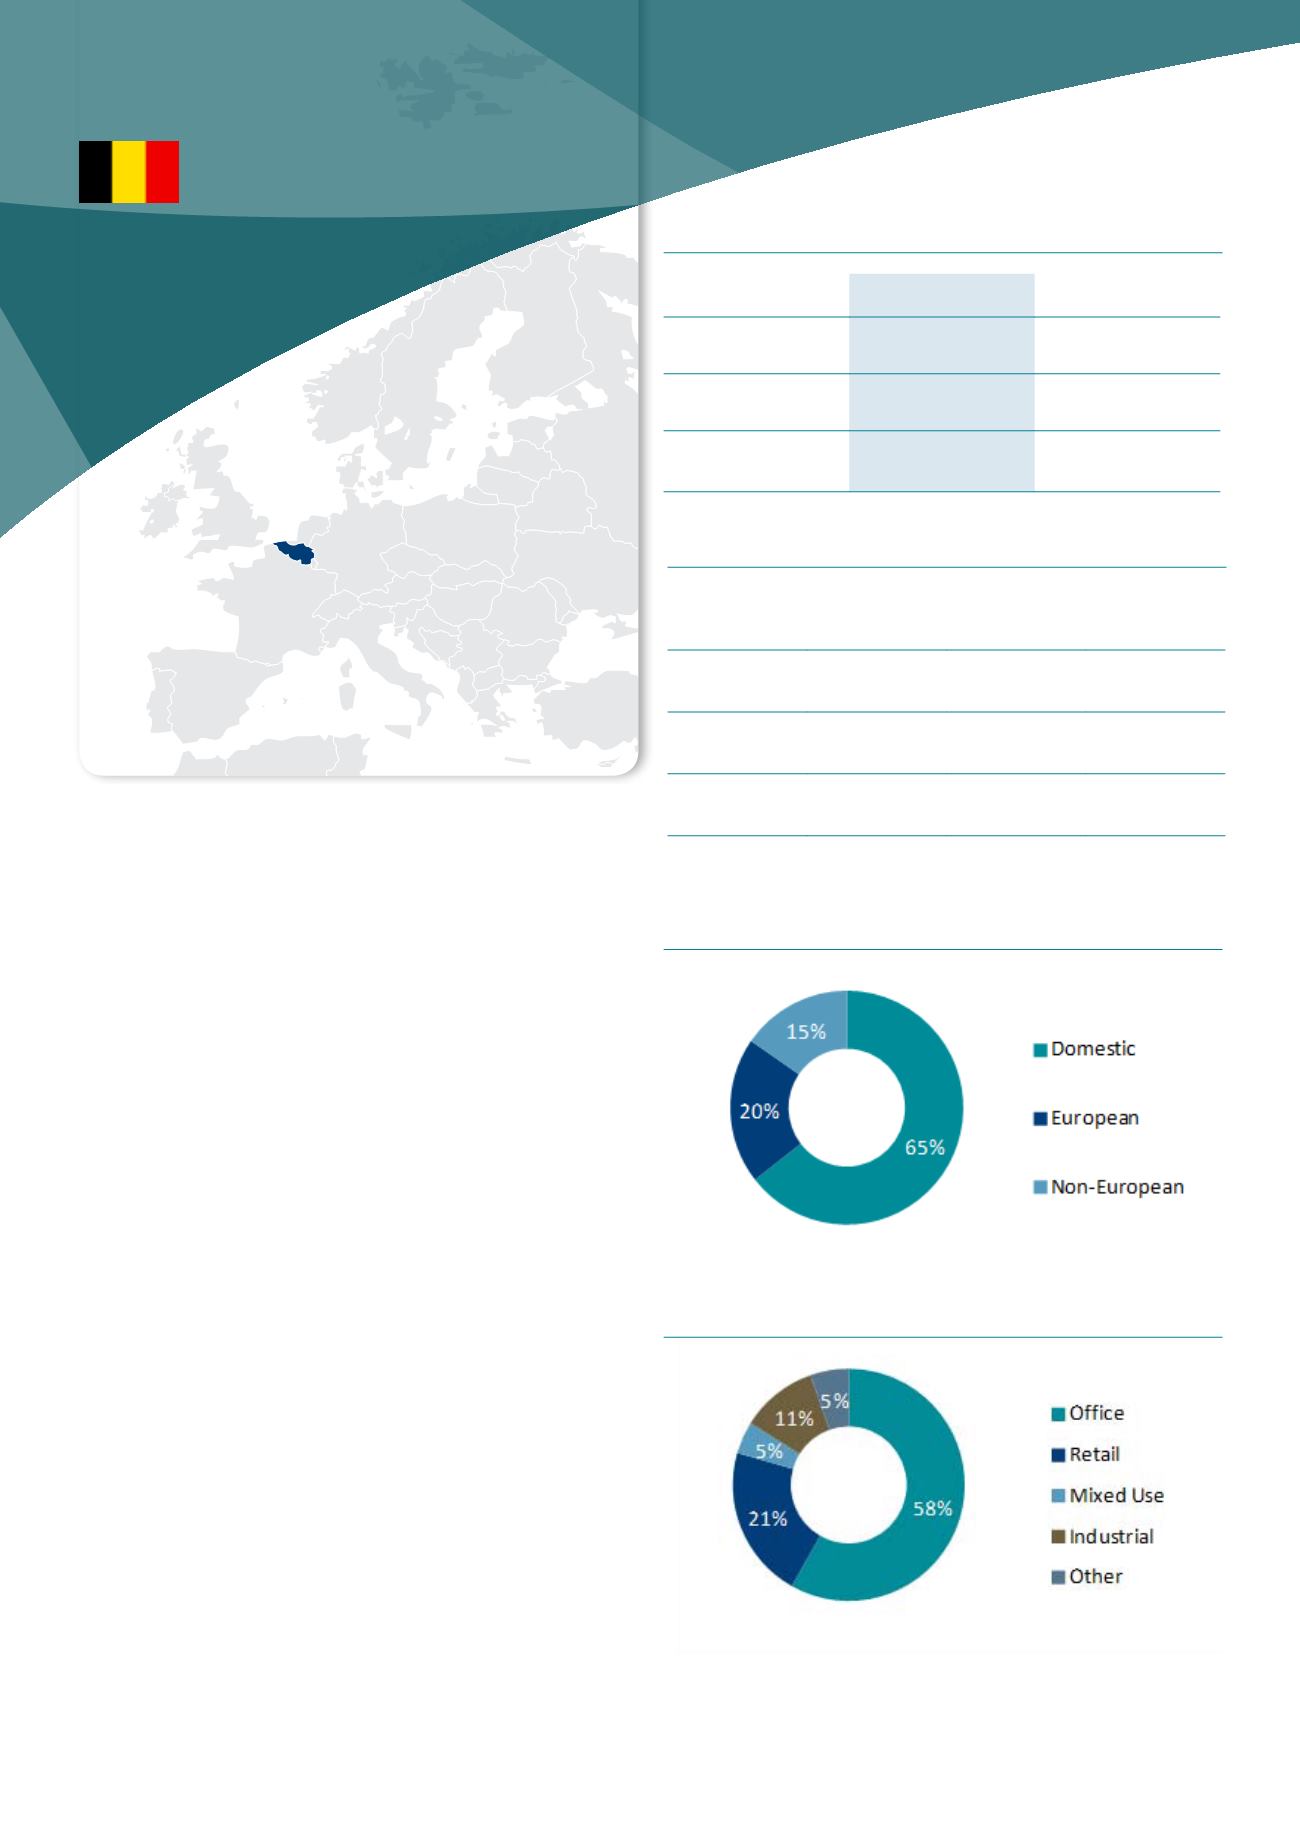
overall activity is dominated by domestic investors, represen-
ting around two-thirds of total activity. More recently investors
from the Middle-East and Asia have been active in the market.
Investments are concentrated in the major cities of the
country and the capital, Brussels, attracts around 50% of the
total investment volume.
The investment market in Belgium is mainly dominated by ins-
titutional investors (such as insurance companies) or Belgian
REITs for which legislation came into effect in 1995. German
open ended funds are also active in the Belgian market.
The Belgian investment market has experienced increasing
activity since 2009, with a total investment volume above EUR
2bn in 2013. The recovery in activity is expected to continue to
push volumes above long run average trends.
The majority of investment, close to 60%, is concentrated in
the office sector. Competition for core office assets is increa-
singly placing yields under downward pressure. Retail and
healthcare (nursing homes) assets remain sought-after by
investors as they constitute secure assets and a good way to
diversify portfolios.
Market sizing
Belgium
Europe
Invested stock*
(Total stock)
EUR 55bn
(EUR 170bn)
EUR 3,380bn
(EUR 8,150bn)
liquidity ratio*
(10y average)
4.0%
(5.0%)
4.0%
(4.5%)
2013 volumes
(10y average)
EUR 2.0bn
(EUR 2.5bn)
EUR 139bn
(EUR 135bn)
Investment activity by asset type, 2013
Source : DTZ Research
Investment activity by source of capital, 2013
Source : DTZ Research
Market pricing – Brussels/Antwerp (Q4 2013)
office
(Brussels)
Retail
(Brussels)
Industrial
(Antwerp)
Current Yield
6.15% 5.00% 7.70%
Min/Max
(10y)
5.50-6.50% 4.25-5.75% 6.80-8.30%
Yield
definition
net initial yield
Source : DTZ Research
BELGIuM
* 2012 figures


