


 78 / 132

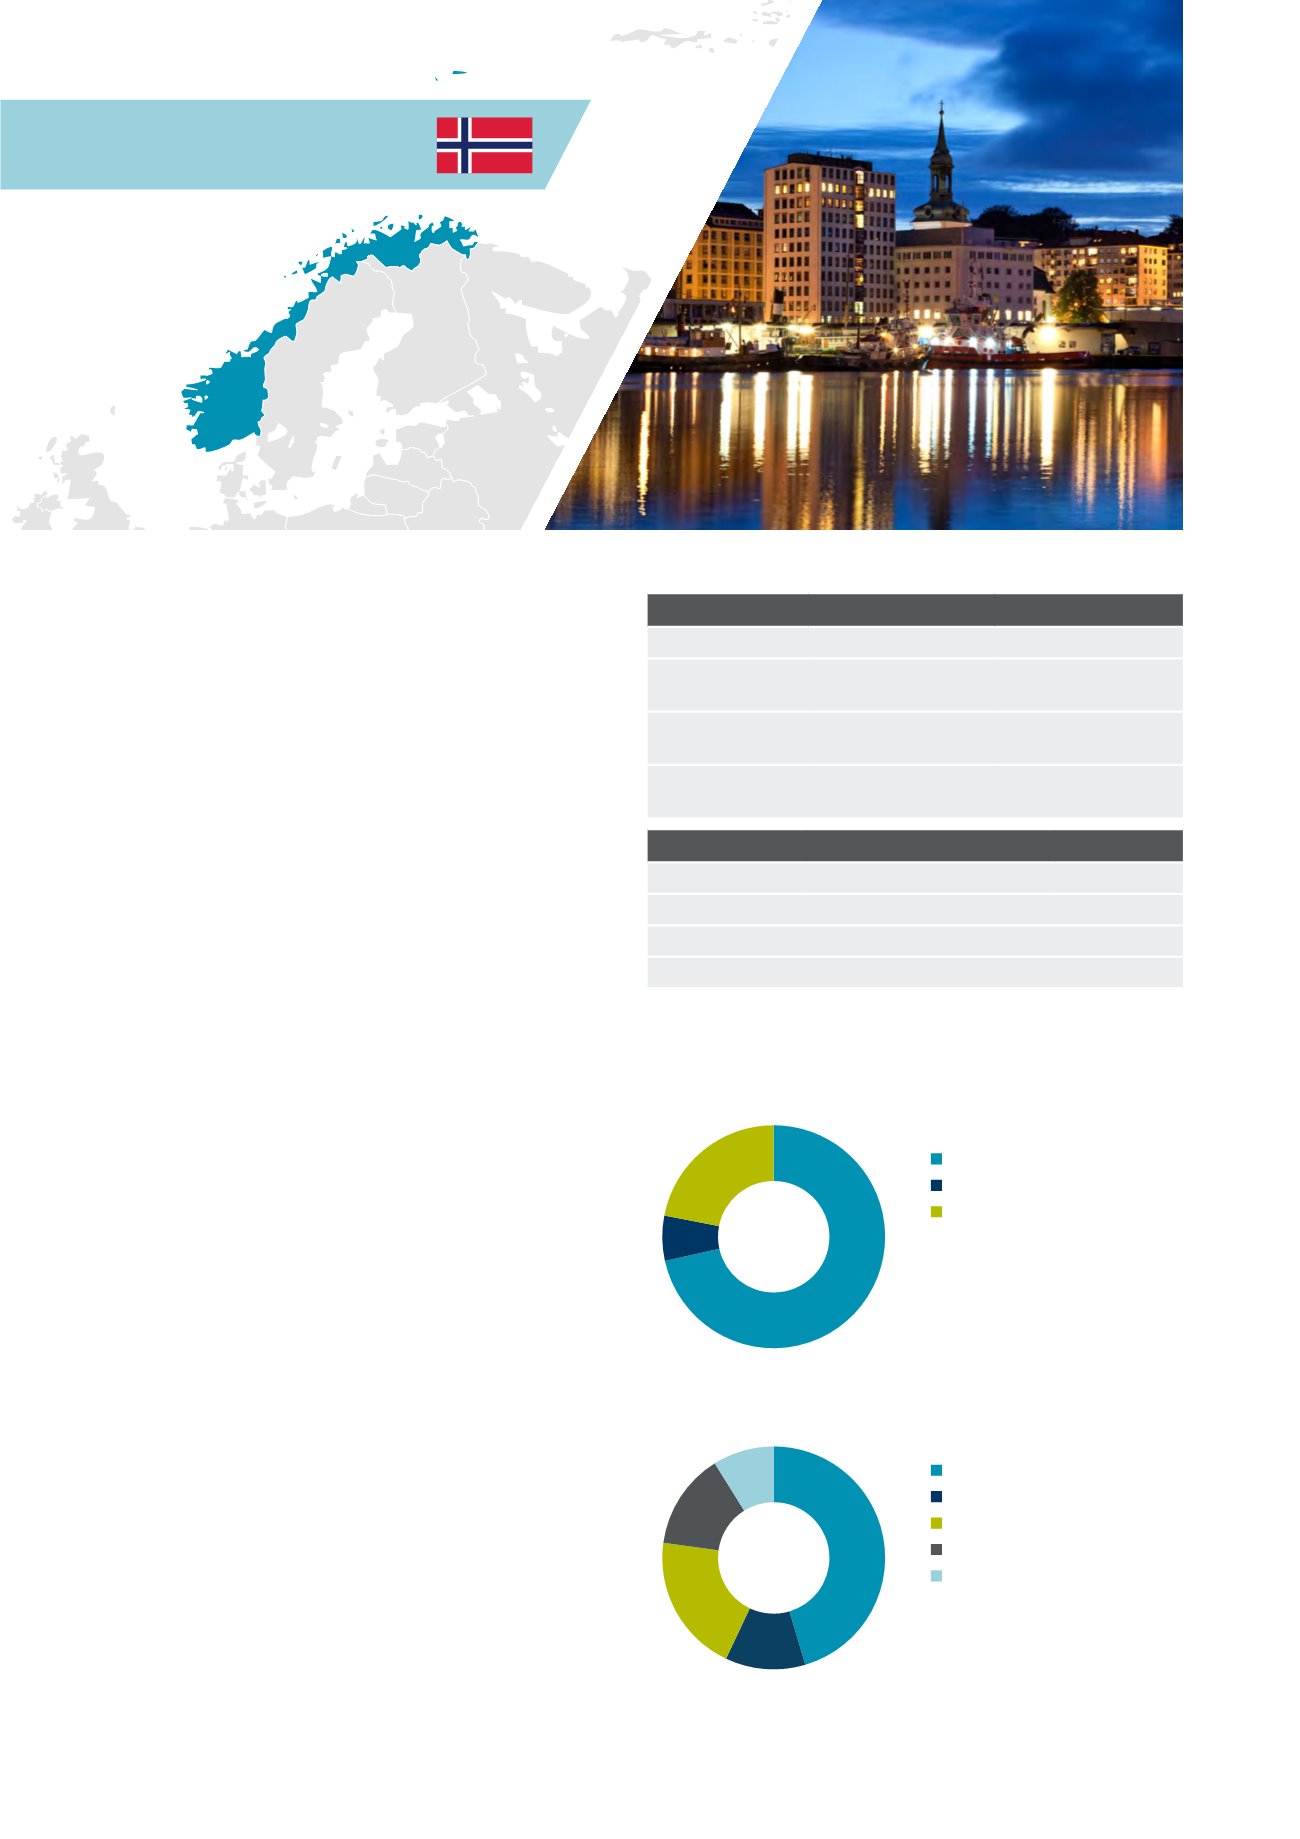
Norway
Norway is a relatively small commercial real
estate market by size compared to larger
countries across Europe, although it is the
second largest market by stock in the Nordics
behind Sweden.
Despite its size it does benefit from relatively high
levels of liquidity, although the majority of investment
is domestically sourced. Over the last ten years over
80% of investors has been Norwegian, rising to over
90% in a number of years. This reflects the ease with
which domestic investors are able to trade with fellow
investors. It is therefore hard for overseas capital
to be invested, except through a fund which has a
presence in the country or region.
Current invested stock and transactional activity
is dominated by private property companies.
Institutions and pension funds as well as listed
companies are also active in the market. Due to high
growth in real estate since 1992, with the exception
of a few dips, Norwegians have preferred to invest in
property instead of other types of investments. Since
2012 we saw growing interest from international
investors looking to invest in Norway, mainly in
the Oslo CBD area. However foreign investors still
account for only a small portion of activity.
Debt funding is relatively easy to secure from
domestic and Scandinavian banks operating in
Norway as the market is seen as stable.
Market sizing
Norway
Europe
Invested stock
(Total stock)
EUR 85bn
(EUR 172bn)
EUR 3,335bn
(EUR 8,201bn)
Liquidity ratio
(10y average)
5.8%
(5.4%)
5.6%
(4.6%)
2014 volumes
(10y average)
EUR 5.0bn
(EUR 3.7bn)
EUR 187bn
(EUR 142bn)
Market pricing – Oslo (Q4 2014)
Office
Retail
Industrial
Current Yield
4.75% 4.75%
6.50%
Min/Max (10y)
4.75-6.75% 4.75-7.25% 4.75-6.75%
Yield definition
Net initial yield
Source: DTZ Research
Investment activity by source of capital, 2014
Investment activity by asset type, 2014
Source: DTZ Research
Source: DTZ Research
Domestic
Non-European
European
Office
Mixed Use
Retail
Industrial
Other
2%
71%
22%
7%
45%
9%
14%
20%
12%
78 Investors Guide to Europe 2015