


 84 / 132

Poland
Poland is the largest and the most mature
commercial real estate market in Central and
Eastern Europe (CEE), with a high proportion
of activity concentrated on the capital,
Warsaw. Poland has strong macroeconomic
fundamentals and a stable political
environment.
Despite being relatively small compared to other
major markets it has attracted high levels of overseas
investment. Domestic players have held a small
market share – 7% of transaction volume over the
last 10 years. The strongest activity has been from
German, UK, Irish, French and Austrian entities.
Prime office buildings located in the Warsaw CBD
and the best shopping centres in major Polish
regions, have been the most sought after asset
class for the last few years. However, along with the
market maturing and economic situation in Europe
improving, property buyers have started to consider
more opportunistic purchases. Additionally, following
the positive development of the industrial market,
to a large extent resulting from the growth of online
retail, industrial properties are becoming a sought
after asset class.
The majority of stock is held by private companies
and funds. Listed companies have a relatively small
share of total holdings. Institutional investment
is limited. These trends are evidenced by recent
transactional activity.
Although Poland, as with other CEE markets has
seen a relatively weak recovery, we do see signs of
improvement. Debt is readily available from both local
banks and German Pfandbriefe Banks which have
been active lenders.
Institutional lending is limited.
Market sizing
Poland
Europe
Invested stock
(Total stock)
EUR 43bn
(EUR 326bn)
EUR 3,335bn
(EUR 8,201bn)
Liquidity ratio
(10y average)
6.7%
(6.2%)
5.6%
(4.6%)
2014 volumes
(10y average)
EUR 2.9bn
(EUR 2.4bn)
EUR 187bn
(EUR 142bn)
Market pricing –Warsaw (Q4 2014)
Office
Retail
Industrial
Current Yield
5.90% 6.00%
7.40%
Min/Max (10y)
5.25-7.00% 5.50-7.50% 6.00-7.75%
Yield definition
Gross initial yield (Net Rental Income/
Net Market value)
Source: DTZ Research
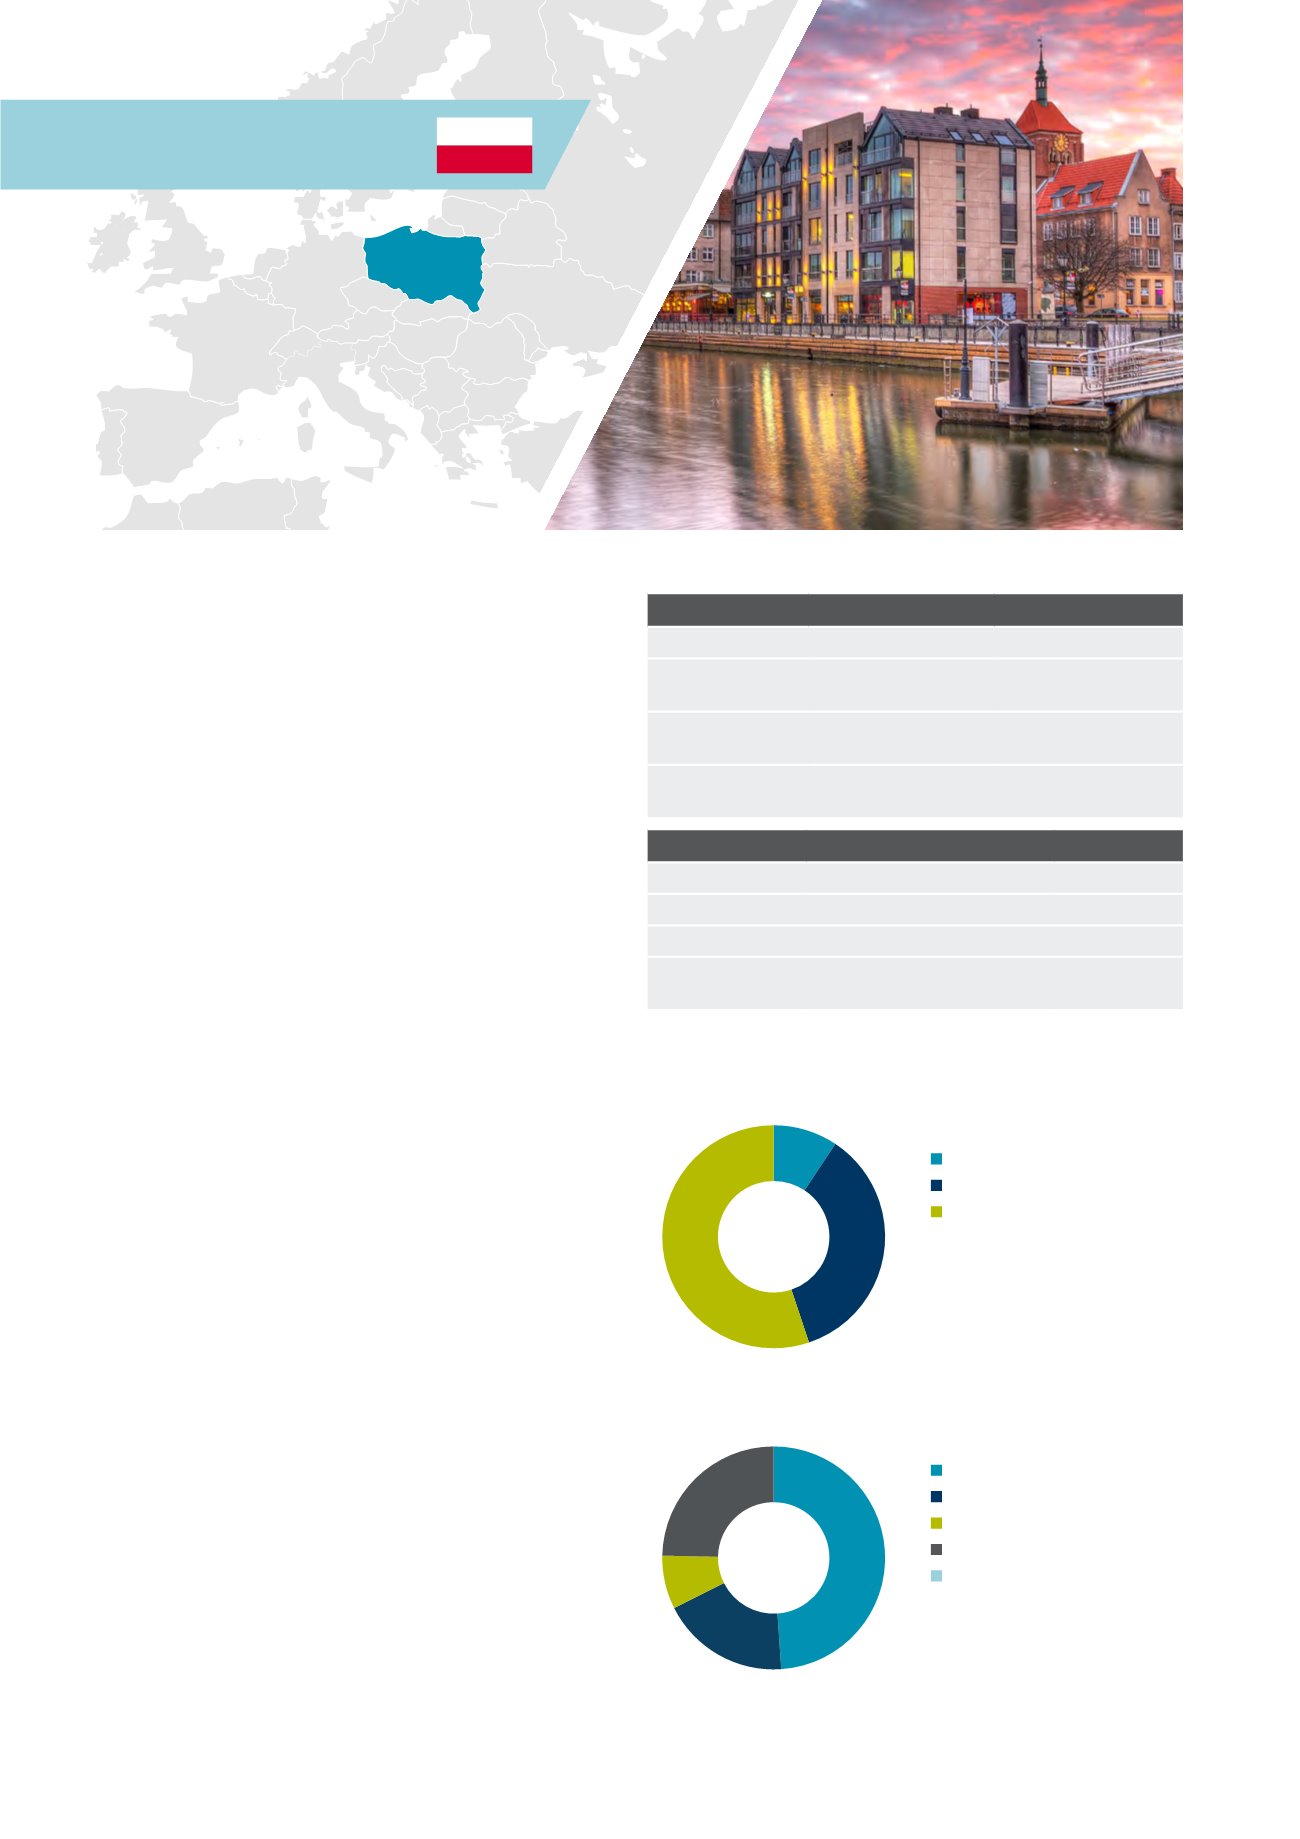
Investment activity by source of capital, 2014
Investment activity by asset type, 2014
Source: DTZ Research
Source: DTZ Research
Domestic
Non-European
European
Office
Mixed Use
Retail
Industrial
Other
9%
36%
9%
55%
49%
25%
8%
18%
84 Investors Guide to Europe 2015