


 52 / 132

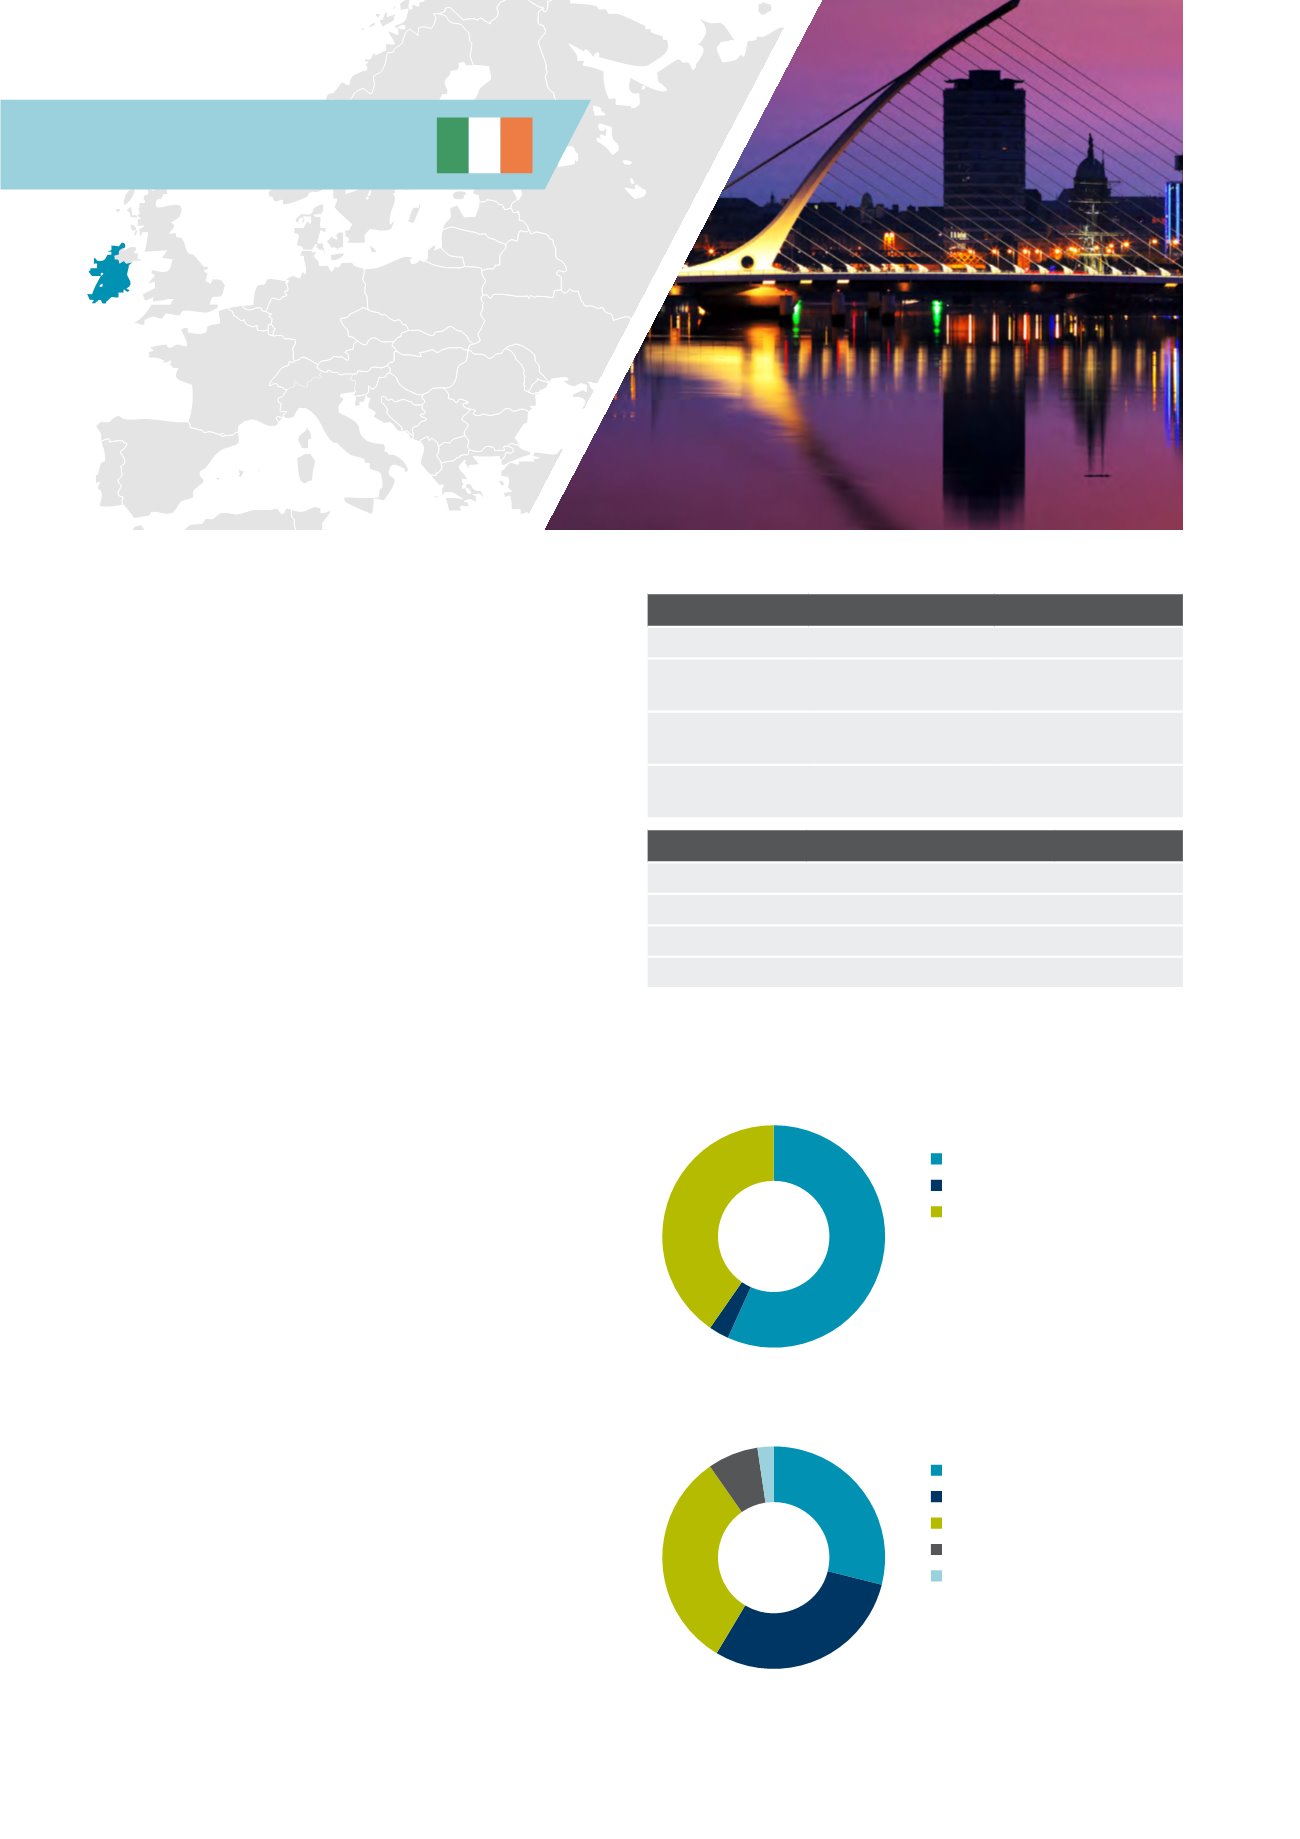
Ireland
The Irish investment market is relatively
small and has historically been dominated by
domestic investors. The market has suffered in
the wake of the global financial crisis.
Following the swift action to create a Bad Bank in the
form of NAMA, the write down of loans and sharp
re-pricing, the Irish market is now witnessing a strong
recovery, underpinned by increased occupier demand,
favourable policy measures and improving economic
sentiment. This is also supported by growing interest
from overseas investors, including the UK, USA and
global opportunity funds.
The Irish market is dominated by Dublin, which
represents the bulk of investment activity, focussed
on office, retail and mixed-use schemes. The strength
of transaction activity has been characterised by a
number of large sales and portfolio sales. In addition,
there has been a noticeable increase in office market
investment activity.
The market has been dominated by private investors
and companies along with institutional investment.
The listed sector has been relatively small. However,
legislation to create REITs came into effect in 2013,
since when Green REIT and Hibernia REIT PLC have
been launched to the market.
The supply of bank finance remains a concern, but
has improved since 2013. Lending remains deal and
borrower specific. The extension of the capital gains
tax window for investors to December 2014 and low
bank deposit rates should see further entrants to the
market as investors look for alternative investments
to inflation proof their capital.
Market sizing
Ireland
Europe
Invested stock
(Total stock)
EUR 50bn
(EUR 78bn)
EUR 3,335bn
(EUR 8,201bn)
Liquidity ratio
(10y average)
6.5%
(2.3%)
5.6%
(4.6%)
2014 volumes
(10y average)
EUR 3.3bn
(EUR 1.2bn)
EUR 187bn
(EUR 142bn)
Market pricing – Dublin (Q4 2014)
Office
Retail
Industrial
Current Yield
4.90% 4.75%
6.50%
Min/Max (10y)
4.00-7.50% 2.50-6.50% 5.50-9.25%
Yield definition
Net initial yield
Source: DTZ Research
Investment activity by source of capital, 2014
Investment activity by asset type, 2014
Source: DTZ Research
Source: DTZ Research
Domestic
Non-European
European
Office
Mixed Use
Retail
Industrial
Other
40%
3%
57%
32%
7% 2%
29%
30%
52 Investors Guide to Europe 2015