


 36 / 132

France
France is the second largest market in Europe
after the UK, and is one of the top three
markets in Europe for investment activity, with
around EUR17bn invested per year on average
over the last ten years.
The investment market is focused on the Greater
Paris Region and accounts for three quarters of the
total investment volume. But investors, finding the
Greater Paris market too competitive and relatively
expensive, are also active in the regional markets,
with an average of EUR 3.5bn invested per year.
French investors dominate the market averaging
around 60% of investment each year, though
their share was higher in 2014. German and North
American investors are also active, typically
deploying over EUR1bn per annum, with UK investors
slightly less.
The main players are the investments funds, followed
by the quoted companies. France has an active REIT
market, which was introduced at the end of 2003.
Since 2009, the French investment market has been
dominated by equity players, notably local SCPI’s and
OPCI’s as well as German open-ended funds.
Thanks to the size of its office market (the biggest
one in Europe) the French market is dominated by
office acquisitions, with a long term average share
of 60% of investments. Retail assets have seen their
market share increase since 2009, reaching a 26%
record level of commitments in 2014.
Debt is relatively easy to secure from traditional
banks, as well as a growing number of institutions and
other debt funds.
Market sizing
France
Europe
Invested stock
(Total stock)
EUR 566bn
(EUR 924bn)
EUR 3,335bn
(EUR 8,201bn)
Liquidity ratio
(10y average)
4.0%
(3.7%)
5.6%
(4.6%)
2014 volumes
(10y average)
EUR 23bn
(EUR 17bn)
EUR 187bn
(EUR 142bn)
Market pricing – Paris (Q4 2014)
Office
(CBD)
Retail
(City)
Industrial
(Paris Region)
Current Yield
4.00% 3.75%
6.50%
Min/Max (10y)
3.75-6.00% 3.75-6.00% 6.50-8.40%
Yield definition
Net initial yield
Source: DTZ Research
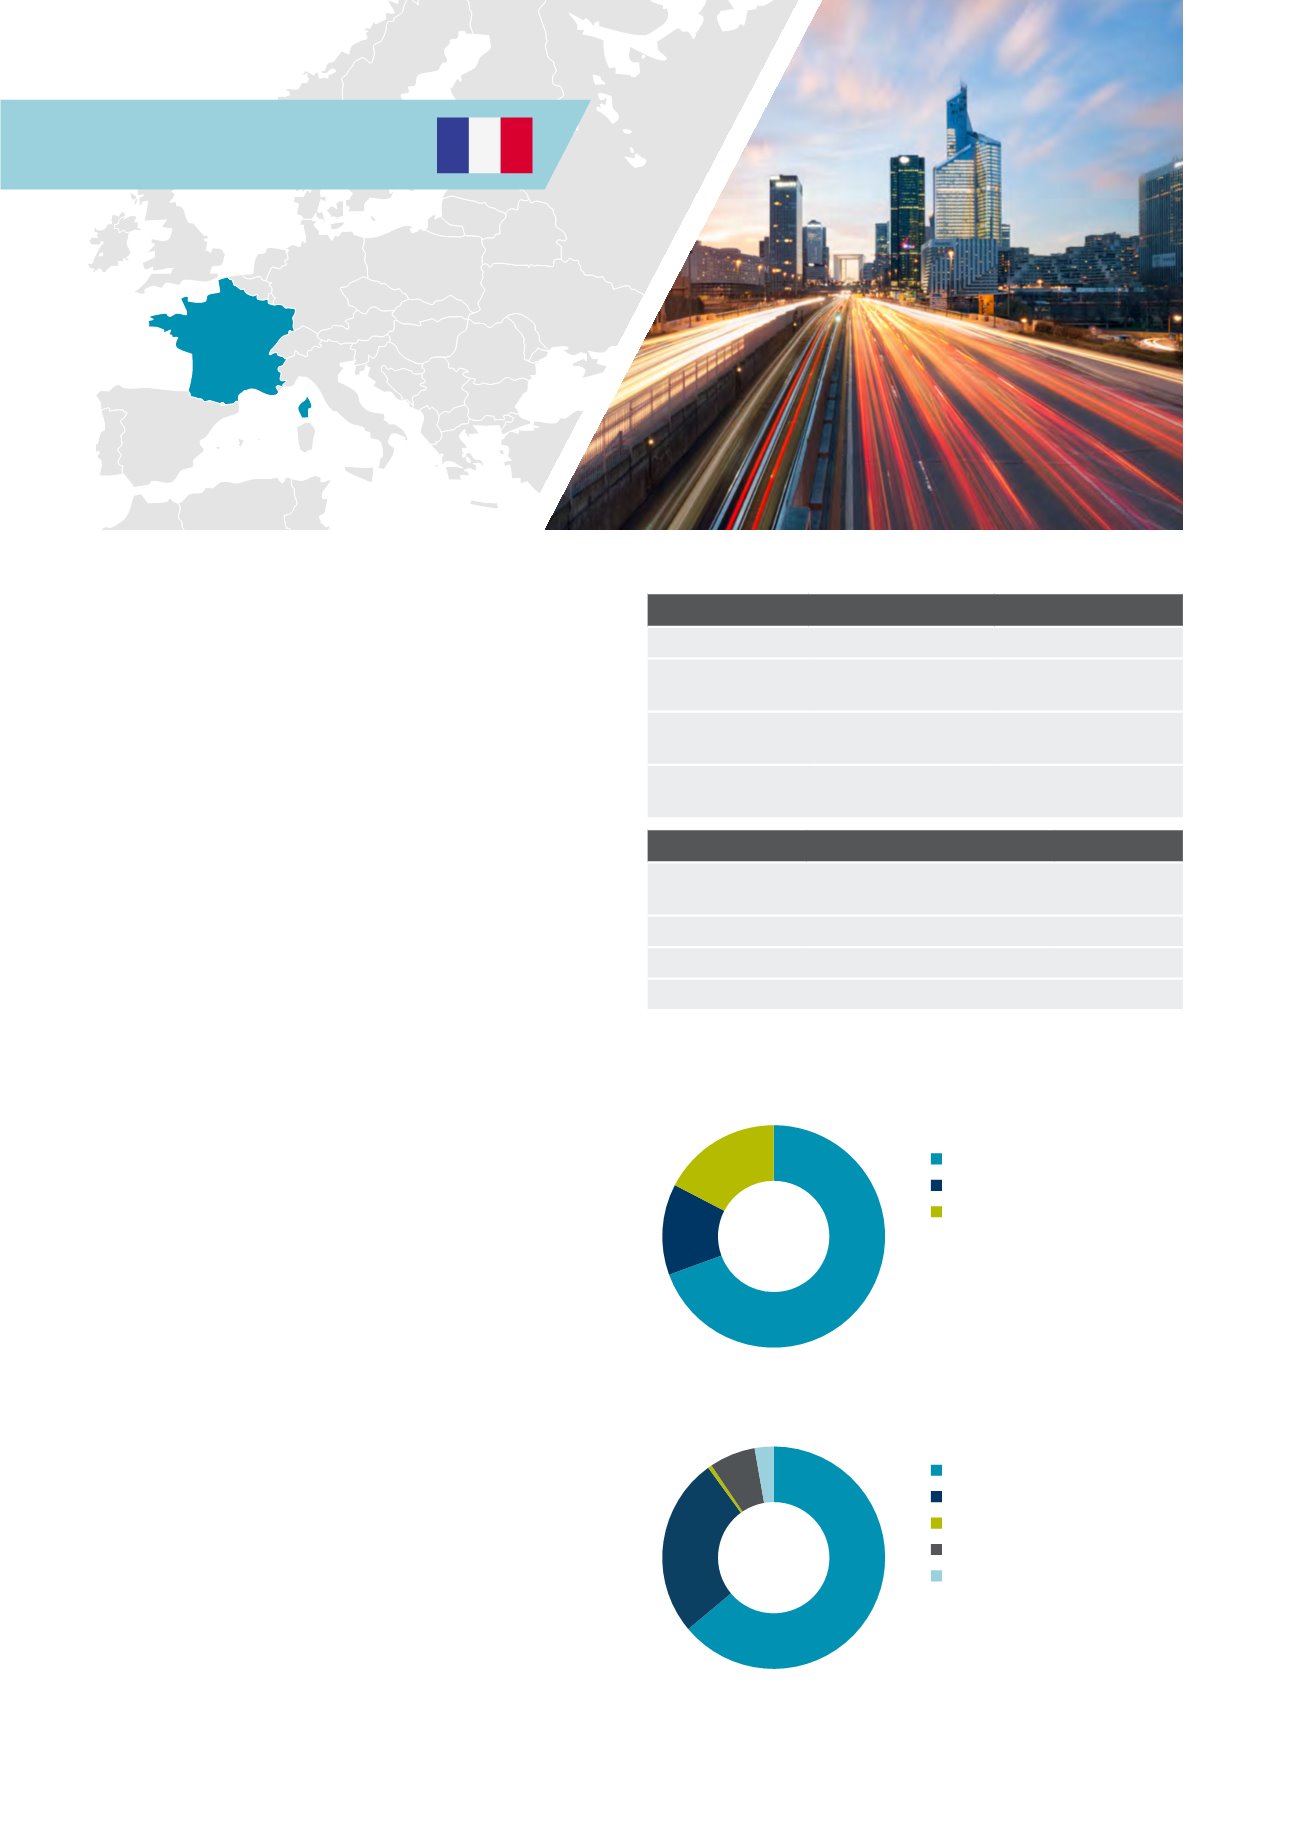
Investment activity by source of capital, 2014
Investment activity by asset type, 2014
Source: DTZ Research
Source: DTZ Research
Domestic
Non-European
European
Office
Mixed Use
Retail
Industrial
Other
40%
29%
13%
17%
70%
3%
64%
26
0%
7%
36 Investors Guide to Europe 2015