


 32 / 132

Finland
Finland’s investment market is just over a third
the size of its neighbour Sweden. Despite being
smaller, it benefits from a well established
domestic investor base as well as growing
interest from overseas investors, especially
from Germany, Sweden, and the USA.
New domestic funds have entered the market,
including the first Finnish REIT. Due to the increasing
amount of new domestic funds and foreign investors
the liquidity of the
Finnish property market has improved and sits in
2014 well above the European average. The positive
trend concerning liquidity is expected to continue.
Measured by population growth, the Helsinki region is
one of the fastest growing areas in the Europe, which
enhances the attraction of the region. The Helsinki
Metropolitan Area (HMA) is the most important
property investment market, with a large part of the
transactions in 2014 occurring in this area.
The legal and taxation system is transparent and the
negotiation culture is straightforward. For example,
the legislation regulating lease agreements is rather
liberal, which gives parties the possibility to agree on
terms and conditions quite freely.
Although there have been economic challenges in the
Eurozone, Finland ranks high in The World Economic
Forum’s Global Competitiveness Index.
Market sizing
Finland
Europe
Invested stock
(Total stock)
EUR 48bn
(EUR 79bn)
EUR 3,335bn
(EUR 8,201bn)
Liquidity ratio
(10y average)
7.1%
(4.1%)
5.6%
(4.6%)
2014 volumes
(10y average)
EUR 3.7bn
(EUR 1.7bn)
EUR 187bn
(EUR 142bn)
Market pricing – Helsinki (Q4 2014)
Office
Retail
Industrial
Current Yield
4.75% 4.80%
6.75%
Min/Max (10y)
4.75-6.60% 4.80-6.50% 6.50-9.00%
Yield definition
Net initial yield
Source: DTZ Research
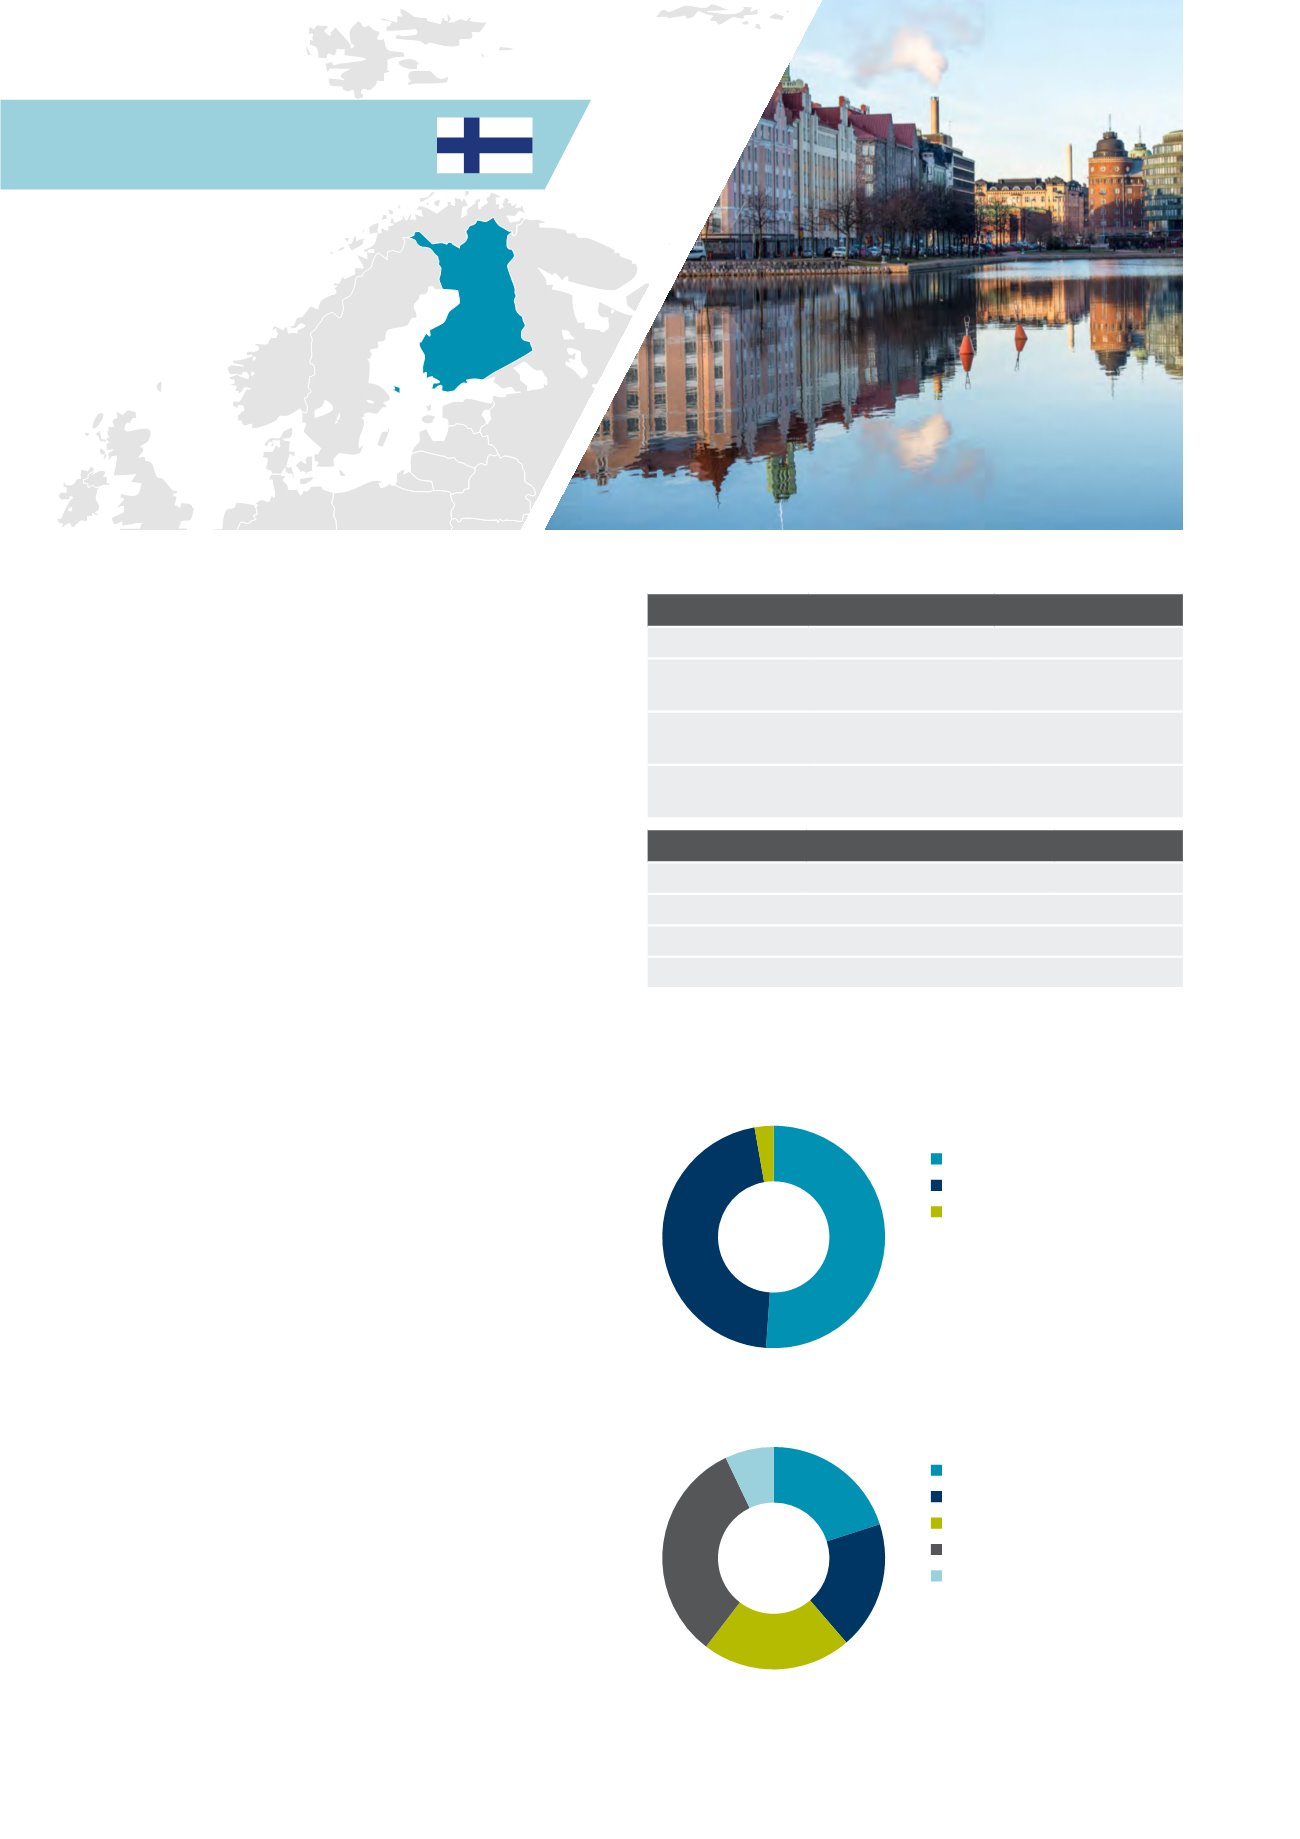
Investment activity by source of capital, 2014
Investment activity by asset type, 2014
Source: DTZ Research
Source: DTZ Research
51%
46%
3%
Domestic
Non-European
European
7%
20%
19%
22%
32%
Office
Mixed Use
Retail
Industrial
Other
32 Investors Guide to Europe 2015