


 14 / 132

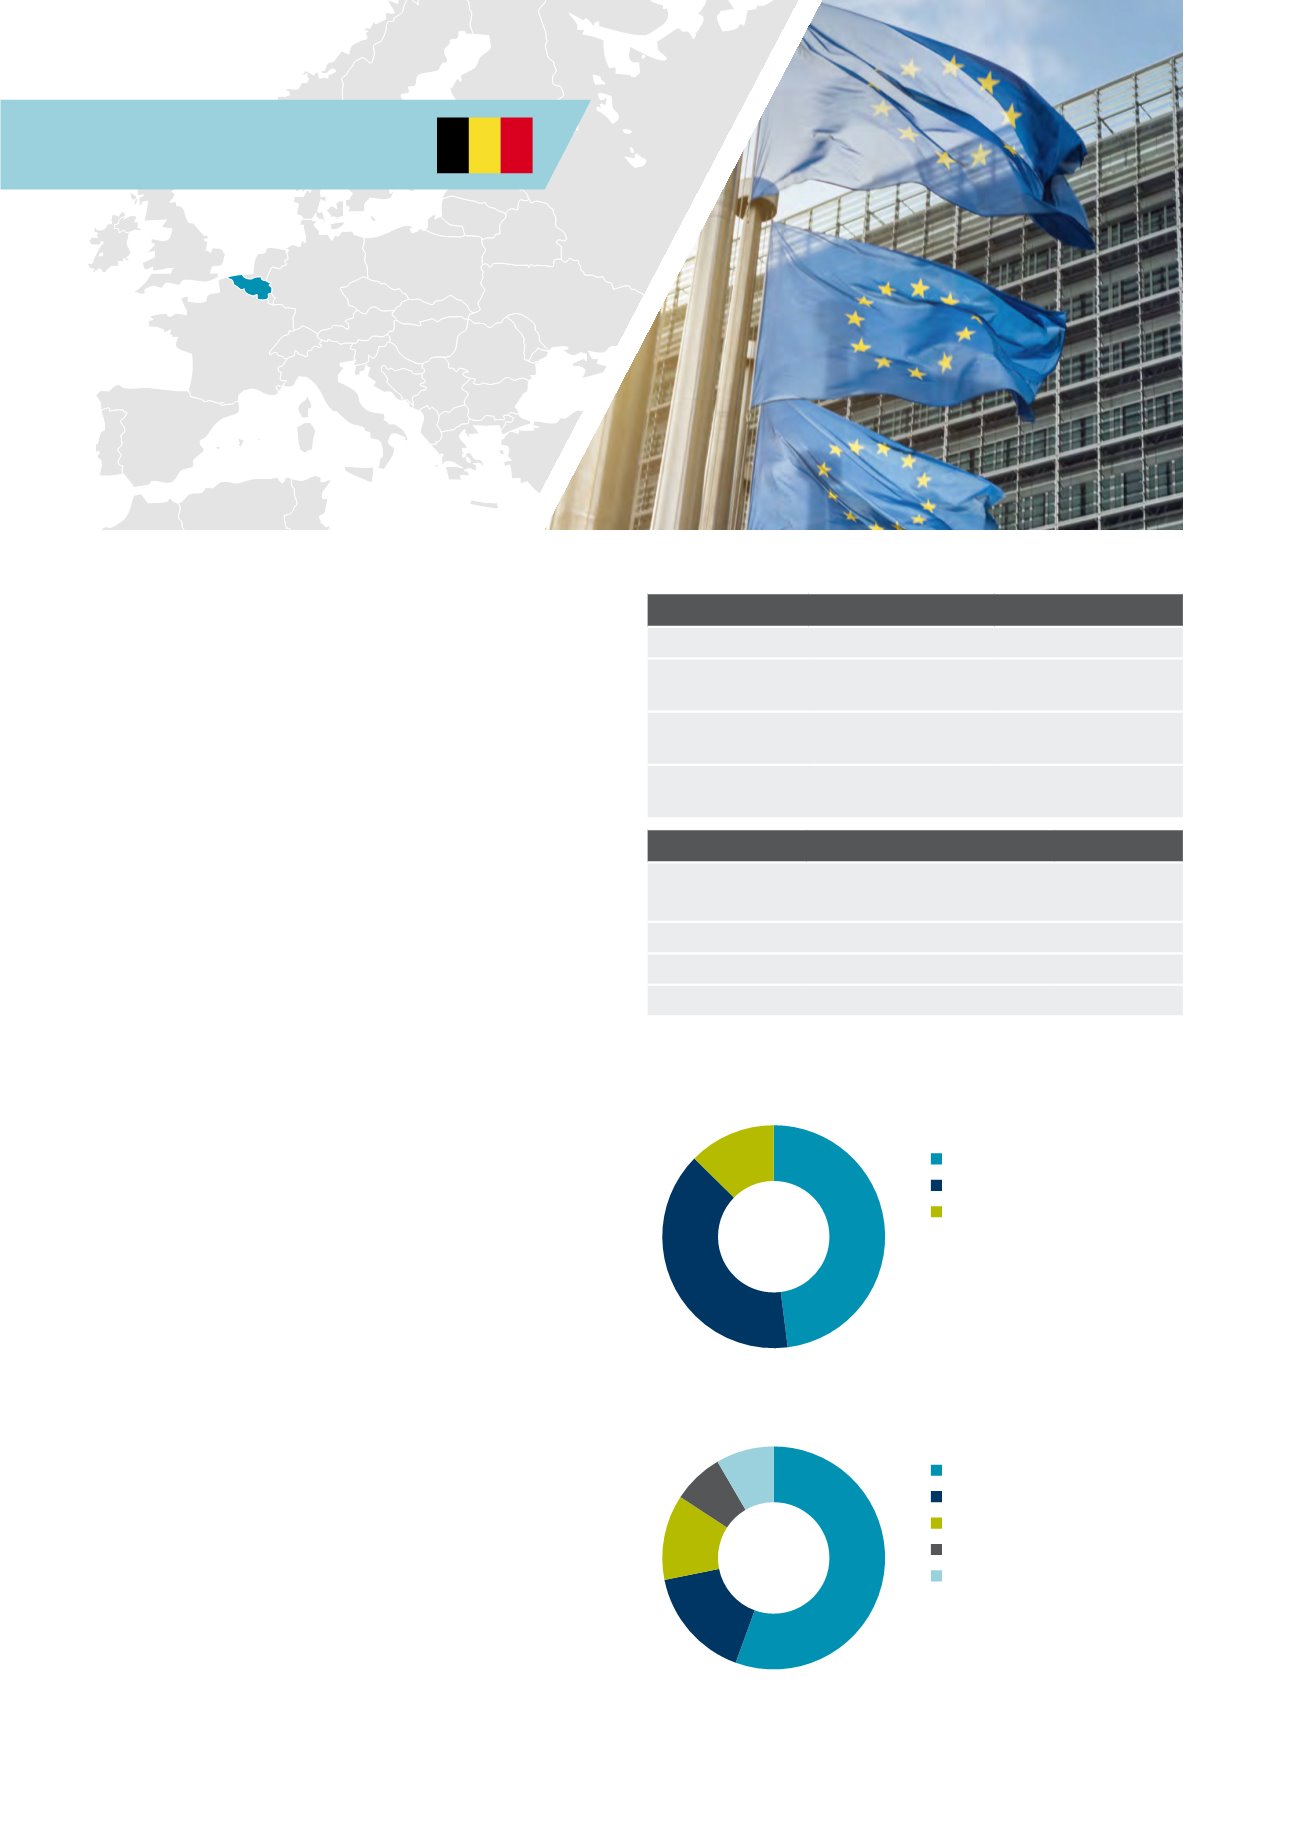
Belgium
Investments in Belgium are mainly dominated
by domestic investors, representing on
average more than 50% of the yearly invested
volumes. The position of Brussels as the
Capital of Europe attracts European investors
coming from the Netherlands, France or
Germany essentially. Furthermore, investors
from Middle-East or Asia are more and more
focusing on visible markets at the European
level and could reinforce their investments in
Belgium in the short term.
The investment market in Belgium is mainly
dominated by institutional investors (such as
insurance companies) or Belgian REITs for which
legislation came into effect in 1995. German Ended
Funds are also active on the Belgian market, both
from the sell-side and the purchaser-side.
Investments are concentrated in the major cities of
the country and the capital, Brussels, attracts around
50% of the total investment volumes.
The Belgian investment market has experienced
consecutive increase in activity since 2009 with a
total investment volume above EUR 3.1bn in 2014, its
highest level since 2009. Signs of economic recovery
and the consolidation on the financial markets should
contribute to increase this level in 2015.
The office sector has concentrated around 60% of
the total investments. Competition is increasing in
this sector, especially for the core assets for which
yields are under pressure. Retail and healthcare
(nursing homes) assets remain sought-after by
investors as they constitute secure asset class and a
good way to diversification of the portfolios.
Market sizing
Belgium
Europe
Invested stock
(Total stock)
EUR 50bn
(EUR 174bn)
EUR 3,335bn
(EUR 8,201bn)
Liquidity ratio
(10y average)
6.1%
(4.9%)
5.6%
(4.6%)
2014 volumes
(10y average)
EUR 3.1bn
(EUR 2.5bn)
EUR 187bn
(EUR 142bn)
Market pricing – Brussels/Antwerp (Q4 2014)
Office
(Brussels)
Retail
(Brussels)
Industrial
(Antwerp)
Current Yield
5.75% 5.00%
7.70%
Min/Max (10y)
5.50-6.50% 4.25-5.75% 6.80-8.25%
Yield definition
Net initial yield
Source: DTZ Research
Investment activity by source of capital, 2014
Investment activity by asset type, 2014
Source: DTZ Research
Source: DTZ Research
14 Investors Guide to Europe 2015
48%
13%
39%
Domestic
Non-European
European
9%
7%
12%
16%
56%
Office
Mixed Use
Retail
Industrial
Other