


 20 / 132

The Czech investment market has matured
over the past decade and is well rated due to its
stability over the recent years. When compared
to other Central and Eastern European (CEE)
markets, the Czech Republic sits alongside
its neighbour, Poland, as the most attractive
markets in the region.
As with other CEE markets the Czech Republic has
attracted a relatively high share of cross border
investment, although in recent years domestic
investors have increased their share, with the market
broadly balanced between domestic and cross
border activity. In particular the market has seen
strong activity from German and Austrian investors,
together with capital from the UK and USA.
Whereby large institutional investors are targeting
mainly prime office or retail properties in Prague,
domestic investors are active across the entire
country, as well as looking at assets with value uplift
potential. In recent years we have seen an increase in
private capital investments.
The listed sector is a very small part of the market.
The inflows of new investors are very encouraging
and should support further growth in the market.
Although the focus of activity has been towards
offices and mixed schemes, the logistics sector has
seen some interest due to stronger occupier demand.
Availability of debt is improving, with a mix of
German, Austrian and local lenders. Activity is
currently focussed on core assets.
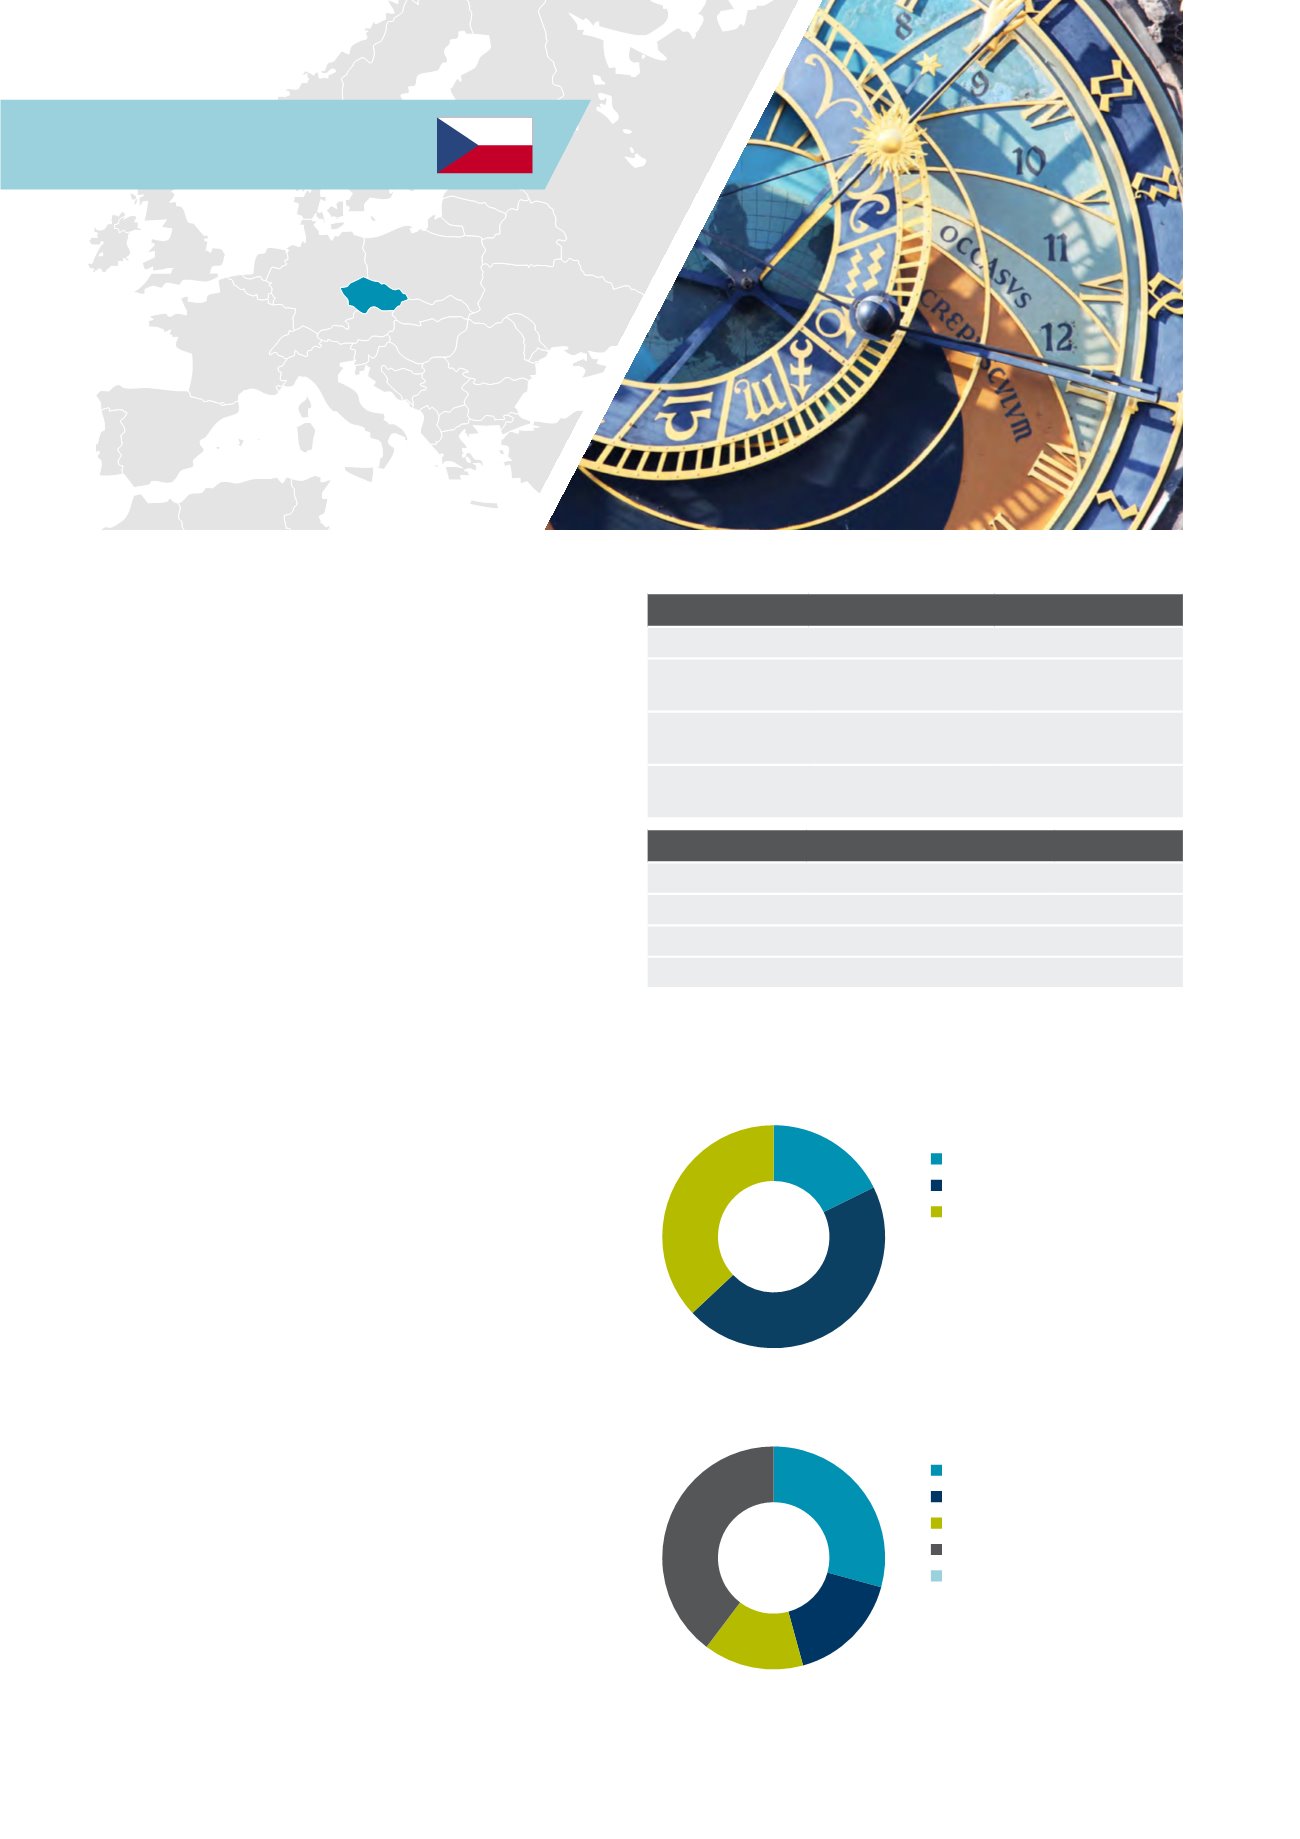
Market sizing
Czech Republic
Europe
Invested stock
(Total stock)
EUR 31bn
(EUR 117bn)
EUR 3,335bn
(EUR 8,201bn)
Liquidity ratio
(10y average)
6.0%
(5.4%)
5.6%
(4.6%)
2014 volumes
(10y average)
EUR 1.8bn
(EUR 1.3bn)
EUR 187bn
(EUR 142bn)
Market pricing – Prague (Q4 2014)
Office
Retail
Industrial
Current Yield
6.00% 5.00%
7.50%
Min/Max (10y)
5.25-7.50% 5.00-7.25% 6.50-9.50%
Yield definition
Gross initial yield
Source: DTZ Research
Investment activity by source of capital, 2014
Investment activity by asset type, 2014
Source: DTZ Research
Source: DTZ Research
37%
45%
18%
Czech Republic
20 Investors Guide to Europe 2015
Domestic
Non-European
European
Office
Mixed Use
Retail
Industrial
Other
40%
15%
16%
29%