


 92 / 132

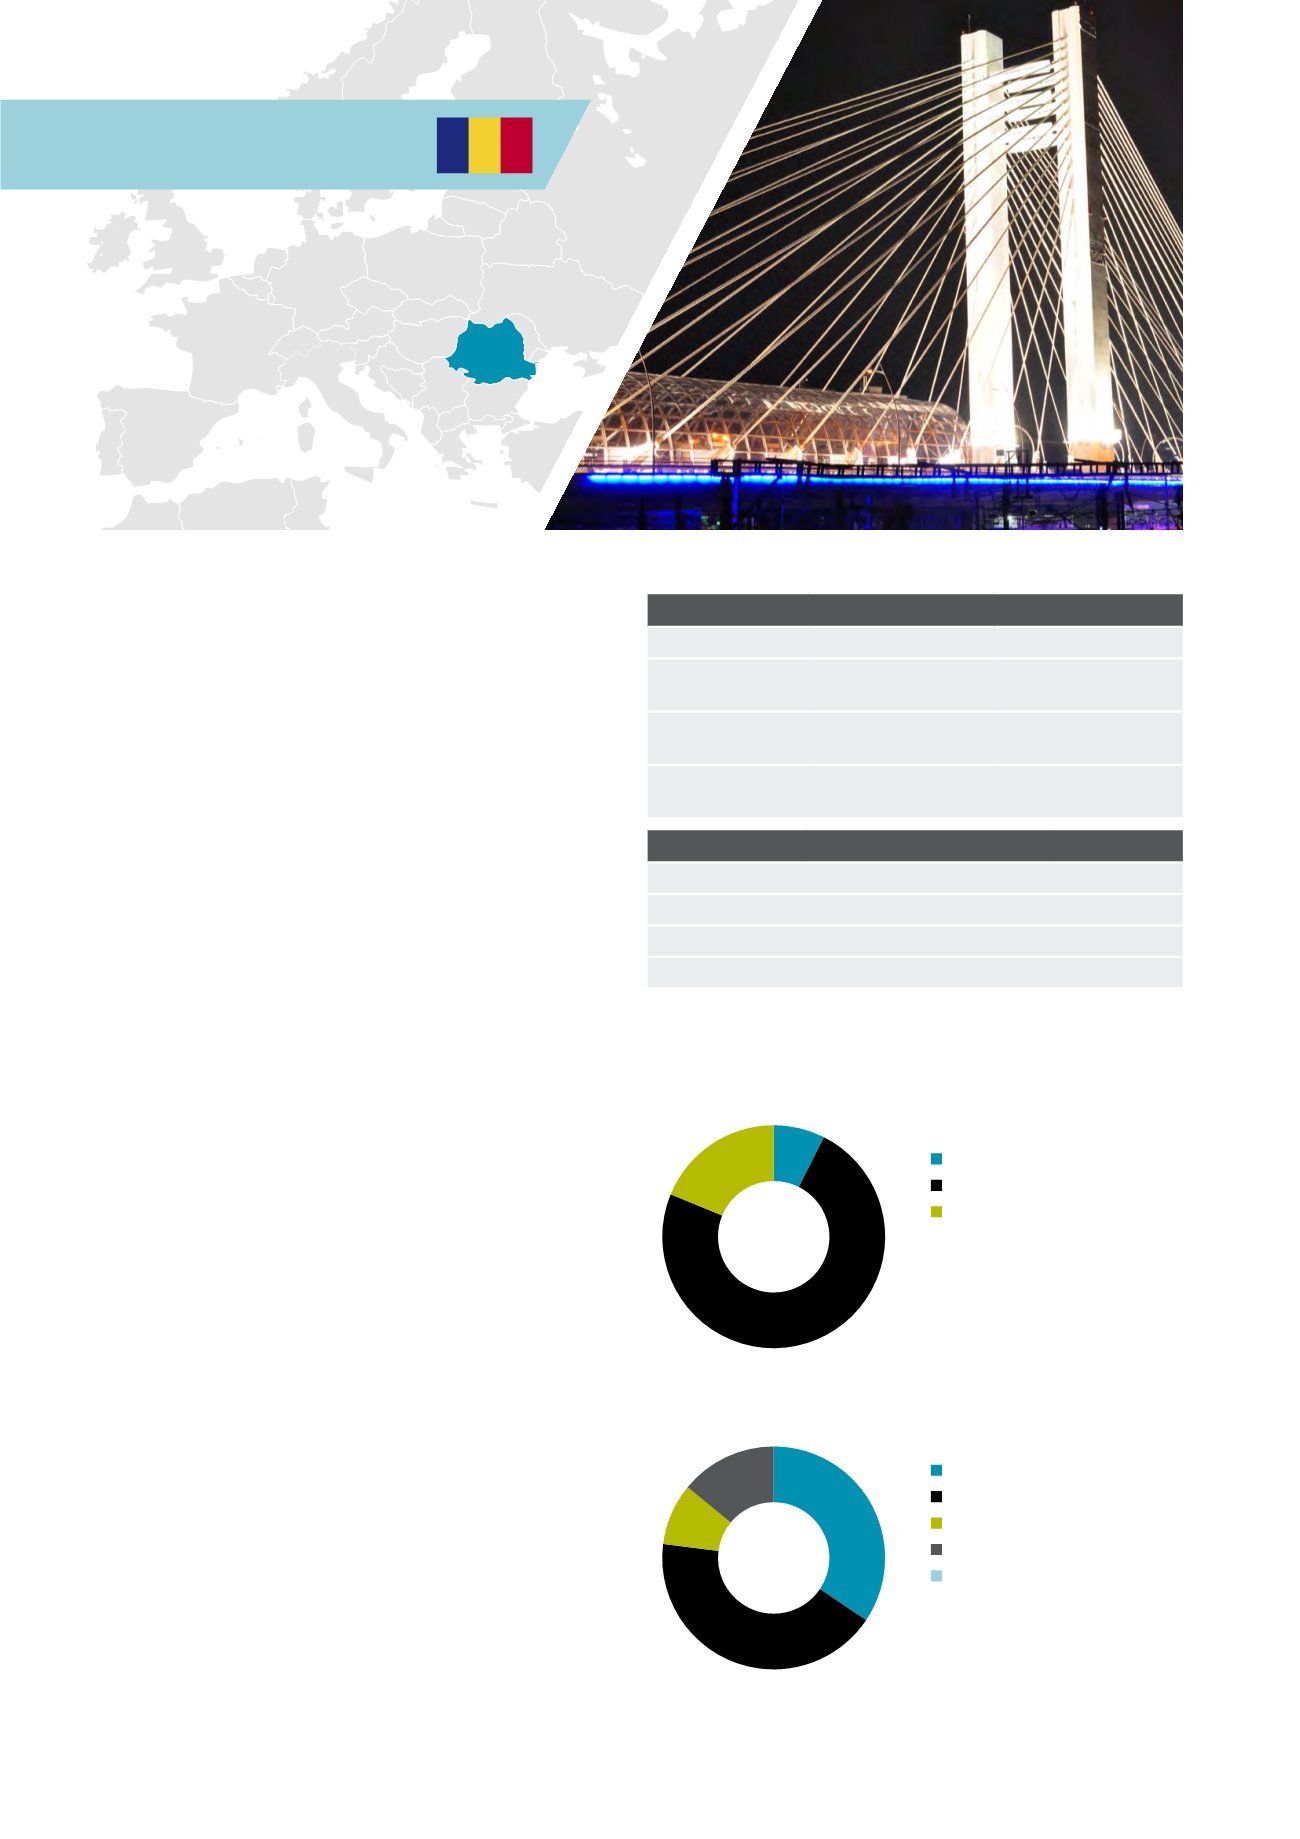
Romania
Romania is the 7th in the EU27 in terms of
population and 2nd in Central and Eastern
Europe (CEE) after Poland. With strategic
geographical location next to the Black Sea,
Romania has substantial natural resources and
tourism potential.
These trends are also reflected in Romania’s invested
stock, which is lower than Poland’s. The majority
of investment activity is centred on the capital,
Bucharest. Romania benefits from European Union
membership, which provides easy access to European
funds, and infrastructure is growing steadily. Romania
also benefits from a state of the art IT infrastructure,
and it is increasingly becoming an important regional
hub for the IT sector, generating demand for office
properties.
Most of the stock is held by private individuals and
companies, as well as listed property companies.
Institutional ownership and activity has been
relatively modest so far.
The country has high potential for economic growth
due to the under development of many economic
sectors including real estate. The large retailers
continue to expand their national chains.
The stock and quality of institutional investment
products is gradually improving, with existing
properties and new developments meeting the
BREEAM or LEED standards.
Market sizing
Romania
Europe
Invested stock
(Total stock)
EUR 39bn
(EUR 109)
EUR 3,335bn
(EUR 8,201bn)
Liquidity ratio
(10y average)
3.3%
(2.7%)
5.6%
(4.6%)
2014 volumes
(10y average)
EUR 1.3bn
(EUR 0.8bn)
EUR 187bn
(EUR 142bn)
Market pricing – Bucharest (Q4 2014)
Office
Retail
Industrial
Current Yield
8.00% 8.00%
9.75%
Min/Max (10y)
5.60-10.50% 6.50-10.50% 7.50-12.00%
Yield definition
Net initial yield
Source: DTZ Research
Investment activity by source of capital, 2014
Investment activity by asset type, 2014
Source: DTZ Research
Source: DTZ Research
Domestic
Non-European
European
Office
Mixed Use
Retail
Industrial
Other
9%
74%
7%
19%
34%
14%
9%
43%
92 Investors Guide to Europe 2015