


 44 / 132

Greece
Market sizing
Greece
Europe
Invested stock
(Total stock)
EUR 1bn
(EUR 10bn)
EUR 3,335bn
(EUR 8,201bn)
Liquidity ratio
(10y average)
2%
n/a
5.6%
(4.6%)
2014 volumes
(10y average)
EUR 0.2bn
n/a
EUR 187bn
(EUR 142bn)
Market pricing – Athens (Q4 2014)
Office
Retail
Industrial
Current Yield
8.25%
7.25%
7.70%
Min/Max (10y)
6.50-8.50% 5.00-7.25% 6.80-8.30%
Yield definition
Gross initial yield
Source: DTZ Research
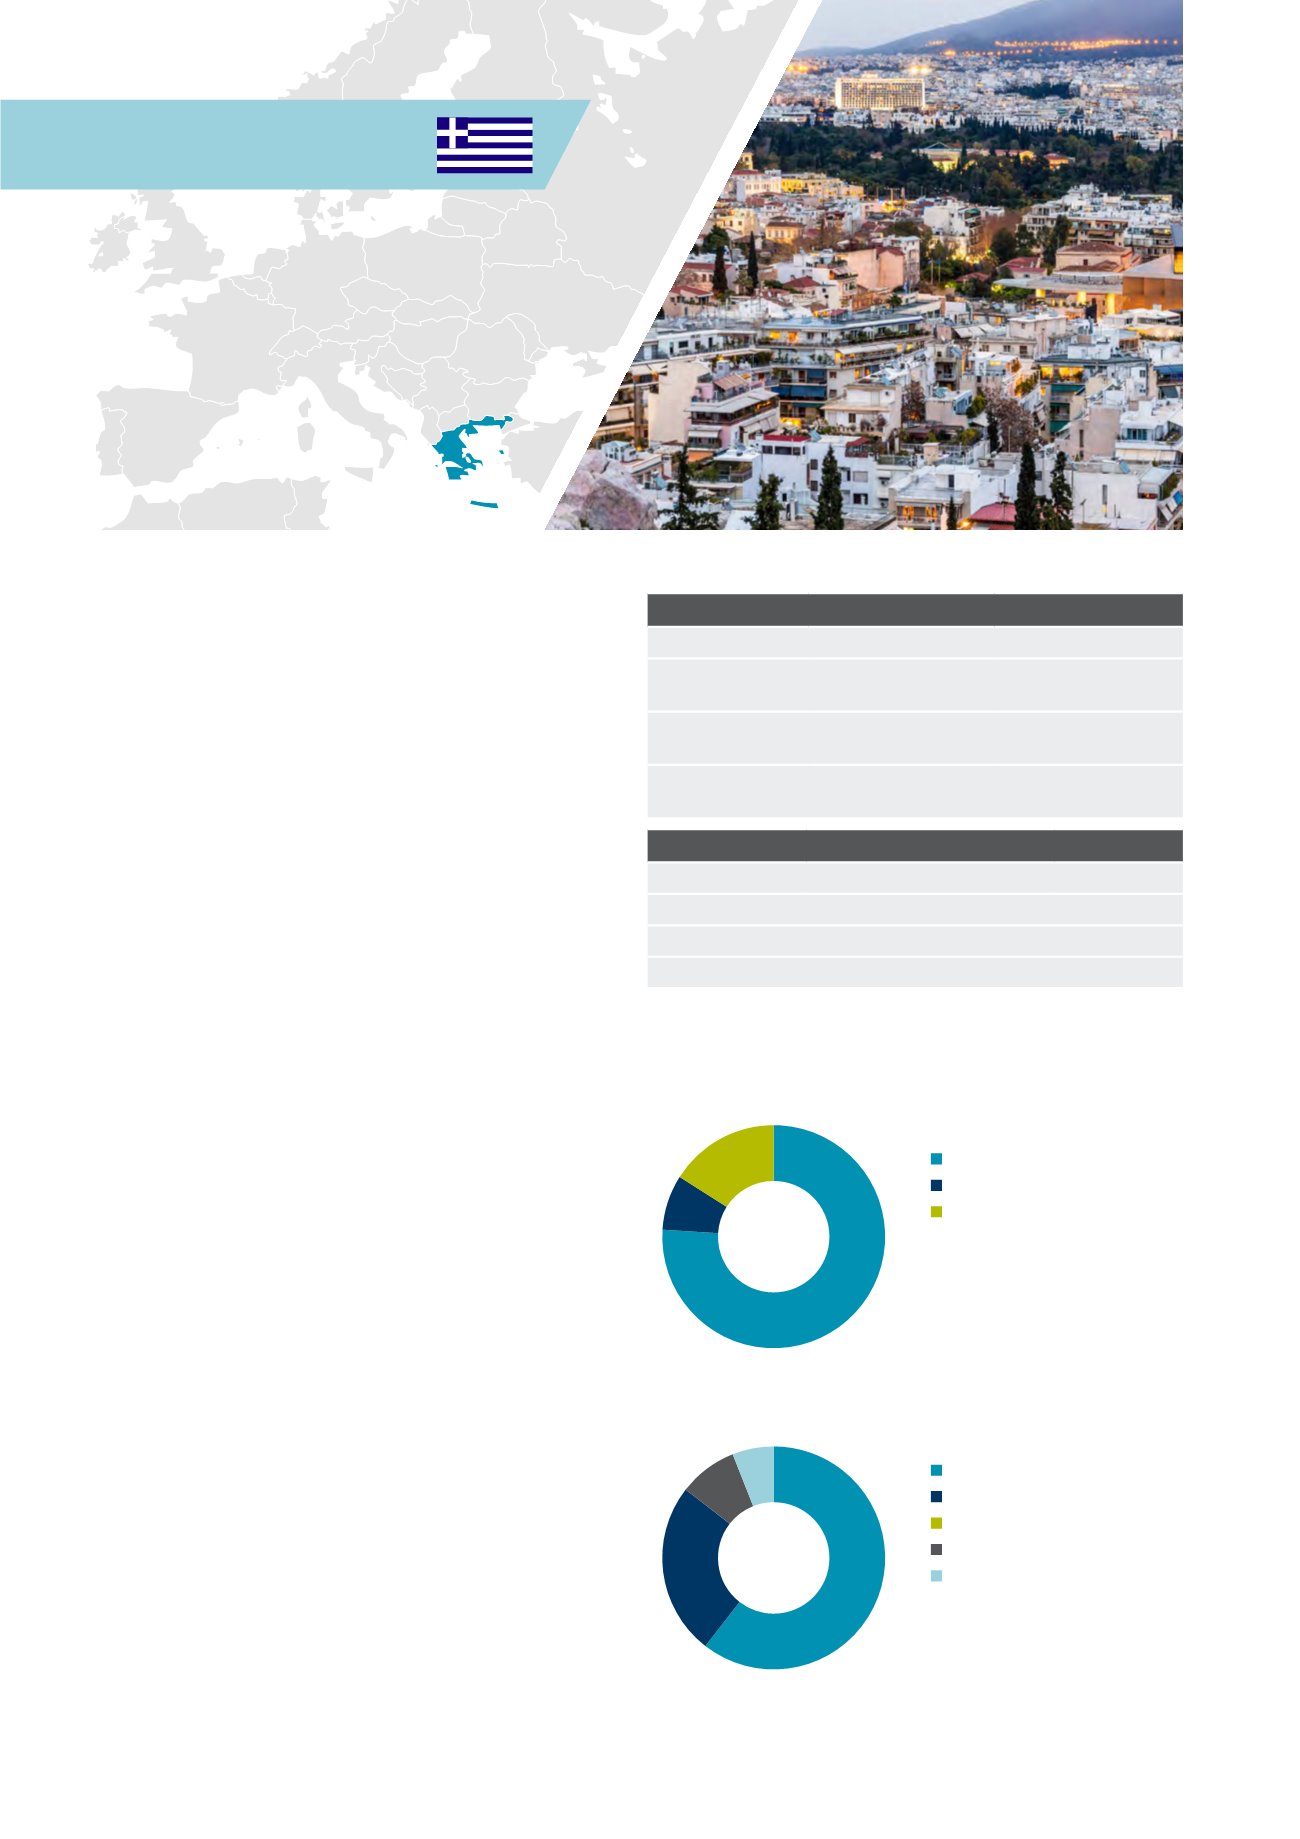
Investment activity by source of capital, 2014
Investment activity by asset type, 2014
Source: DTZ Research
Source: DTZ Research
Domestic
Non-European
European
Office
Mixed Use
European
Industrial
Other
The Greek real estate market made a
comeback on investors’ map in 2014, only to
be interrupted by the political instability. On
the condition that the political and economic
setting will stabilise, the real estate market
of Greece offers a variety of investment
opportunities particularly in the hotel and
logistics sectors. Athens has been upgraded
to the 5th position according to its investment
prospects based on the 2015 Emerging Trends
in Real Estate report issued by ULI and PwC.
After six years of continuous economic crisis that
resulted in a cumulative decline in GDP by 25%,
2014 marked the return of the Greek economy to
positive territory with a growth rate of 0.8%. Driving
forces were the increase in exports of goods and
services and the growth in private consumption. The
momentum the economy had gained was interrupted
during Q4 of 2014 by the increased uncertainty in
the political environment. The announcement of early
elections along with the negotiations with the EU,
ECB and IMF lead, once again, to economic instability.
The outcome of these negotiations will be the main
determinant for the country’s economy. If these
uncertainties are mitigated, the economy can and
should continue its recovery path in 2015.
Opportunities are identified in the massive €70 bn.
Non-performing loan portfolios of the Greek Banks
that face liquidity problems and the challenge to
handle thousands of litigation cases.
60%
8%
9%
6%
76%
8%
16%
44 Investors Guide to Europe 2015