


 108 / 132

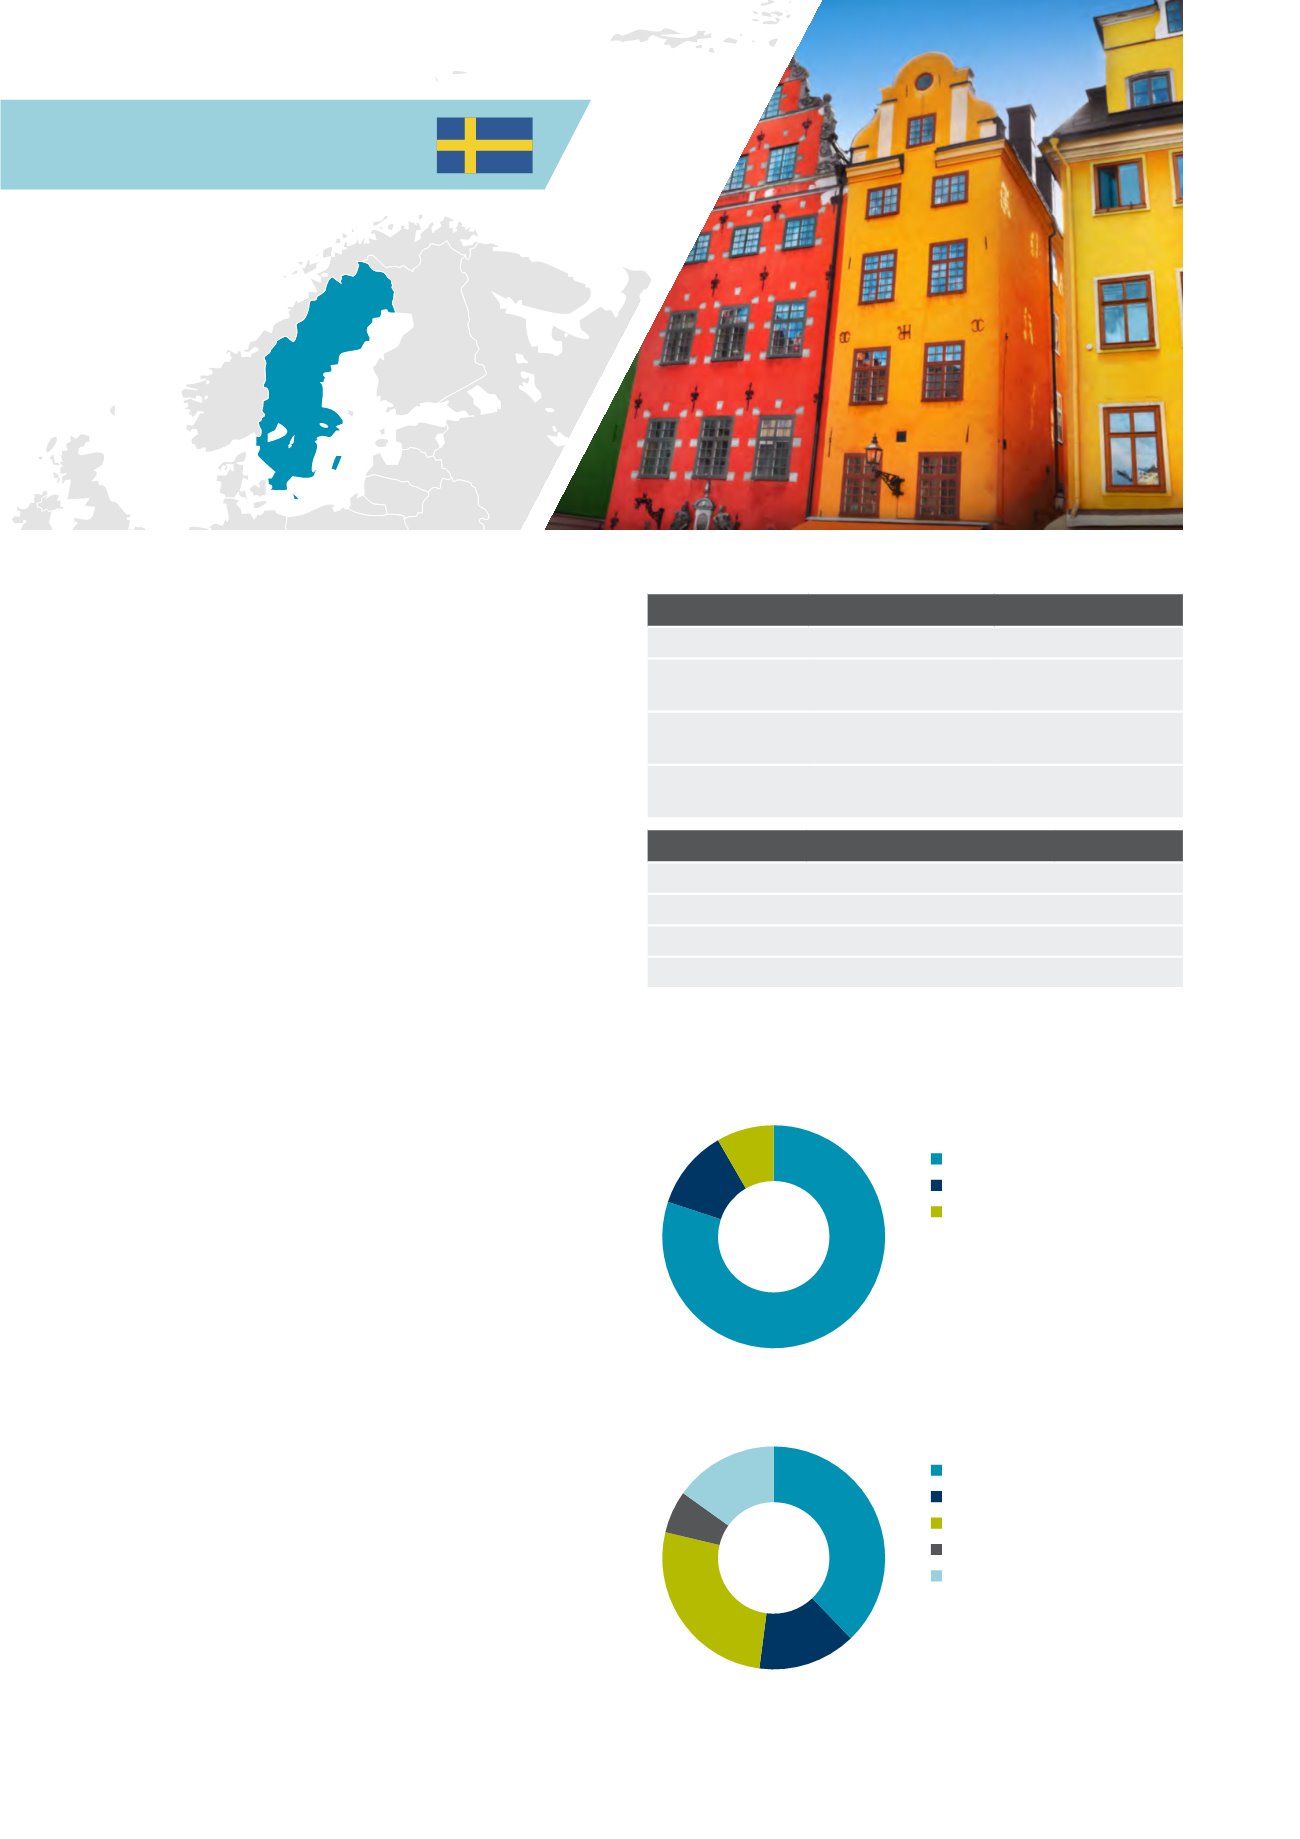
Sweden
Sweden is the largest of the Nordic markets by
stock and the ninth largest market in Europe.
Although smaller than the UK, Sweden has had
the highest liquidity ratio over the past ten years
and is the second most liquid market globally.
Investment is not just focussed on the capital
Stockholm, but also across the country, which
provides more diversity for investors. The country has
a strong investor base, with many active institutions
and property companies. It also has an active listed
sector, although there are no REITs in Sweden.
Historically the market has seen strong levels of
domestic investment as well as overseas investors,
notably from neighbouring Norway and the UK. There
are also a number of funds active in sourcing capitals
from global investors.
Most investors focus on high-quality prime real
estate, especially within the office and retail
segments. Foreign investors concentrate mostly on
prime retail and logistics properties let on long-term
contracts. As there is a limited supply of property for
sale in the prime segment, an increasing number of
investors are tapping into the secondary segment.
Although impacted by the financial crisis, Sweden
has been seen as a relative safe haven, and market
activity recovered strongly from a low in 2009. Much
of this activity has been driven by domestic investors.
Swedish banks have also retained healthy balance
sheets and have not been as exposed to under-
performing loans. Debt is readily available, mostly
from traditional banks. Institutional lending remains
limited.
Market sizing
Sweden
Europe
Invested stock
(Total stock)
EUR 125bn
(EUR 160bn)
EUR 3,335bn
(EUR 8,201bn)
Liquidity ratio
(10y average)
9.4%
(8.8%)
5.6%
(4.6%)
2014 volumes
(10y average)
EUR 11.9bn
(EUR 9.2bn)
EUR 187bn
(EUR 142bn)
Market pricing – Stockholm (Q4 2014)
Office
Retail
Industrial
Current Yield
4.35% 4.25%
6.75%
Min/Max (10y)
4.25-5.75% 4.25-5.75% 5.75-7.75%
Yield definition
Net initial yield
Source: DTZ Research
Investment activity by source of capital, 2014
Investment activity by asset type, 2014
Source: DTZ Research
Source: DTZ Research
Domestic
Non-European
European
Office
Mixed Use
Retail
Industrial
Other
80%
8%
12%
38%
14%
27%
6%
15%
108 Investors Guide to Europe 2015